Mapping Homelessness: Visualizing Trends and Challenges

Data
HUD: Annual Homeless Assessment Report (AHAR)
Source
U.S. Department of Housing and Urban Development (HUD)
Find on PolicyMap
- Demographics
- Homelessness
In the wake of the recent U.S. Supreme Court decision backing anti-camping laws, which significantly impacts homeless individuals across the nation, PolicyMap’s U.S. Department of Housing and Urban Development (HUD) Homelessness data update comes at a crucial time. This refreshed dataset provides essential insights into homelessness, helping communities and policymakers better understand and respond to the ever evolving challenges faced by homeless populations.
The data comes from HUD’s Annual Homelessness Assessment Report (AHAR), which displays a snapshot of homelessness in the United States on a single night. The AHAR contains point-in-time (PIT) counts of people experiencing homelessness on a single night in January.1 The PIT estimates are collected by local planning bodies within HUD-defined Continuums of Care (CoC). The CoCs coordinate a full range of homelessness services in a geographic area, which may cover a city, county, metropolitan area, or an entire state. All available HUD Homelessness data is available on PolicyMap from 2007 to 2023.
2023 reported record high numbers of people experiencing homelessness in America
The 2023 PIT count reported the highest number of people experiencing homelessness on a given night since 2007, when AHAR reporting began. There were roughly 653,100 people experiencing homelessness on a given night in 2023. Just between 2022 and 2023, the total number of people experiencing homelessness in America increased by 12.13%.

From 2022 to 2023, states with the largest percentage increases of homelessness included New Hampshire (52.09%), New Mexico (50.08%), New York (39.12%), and Colorado (38.88%). These states are shaded in dark purple on the map below. On the contrary, states with the largest percentage decreases of homelessness included Louisiana (-57.02%), Delaware (-47.45%), Mississippi (-17.89%), and Wyoming (-17.9%). These states are shaded in yellow on the map below.
Users can also access trend charts that provide quick comparisons of homelessness across neighboring states. These numbers can offer insight into the state of homelessness in a specific region.

Explore trends in homelessness across different populations
The data can be further broken down to discover trends within specific populations, including sheltered and unsheltered homelessness, veterans, chronically homeless, and unaccompanied youth along with the age, gender, and race or ethnicity for each group.
Disaggregating the data can uncover specific trends and changes that may not be visible when looking at total numbers of people experiencing homelessness nationwide. For instance, out of total PIT estimates for the homeless population, the PIT estimates of Asians experiencing homelessness increased 40% within the past year. States with the highest percentage increases are shaded in dark purple.
Another example is veterans experiencing homelessness. Despite the overall increase in homelessness nationwide, the number of veterans experiencing homelessness across the nation has drastically declined over the past decade. This decrease comes alongside robust national initiatives, like millions of dollars for HUD-Veterans Affairs Supportive Housing (HUD-VASH) vouchers and the Biden Administration’s push to end veteran homelessness through the Unity Agenda. Data for veterans experiencing homelessness can be further disaggregated by race and ethnicity or gender.
Map showing Point-in-Time estimates of Female homeless veteran population in January 2023.
Tailor evidence-based interventions for your CoC
The HUD homelessness data is available on PolicyMap at nation, state, and CoC-level boundaries. The CoC boundaries are defined by HUD’s CoC Program, which provides funding to states, nonprofit providers, and local organizations to promote community-wide planning and strategic use of resources to address homelessness.
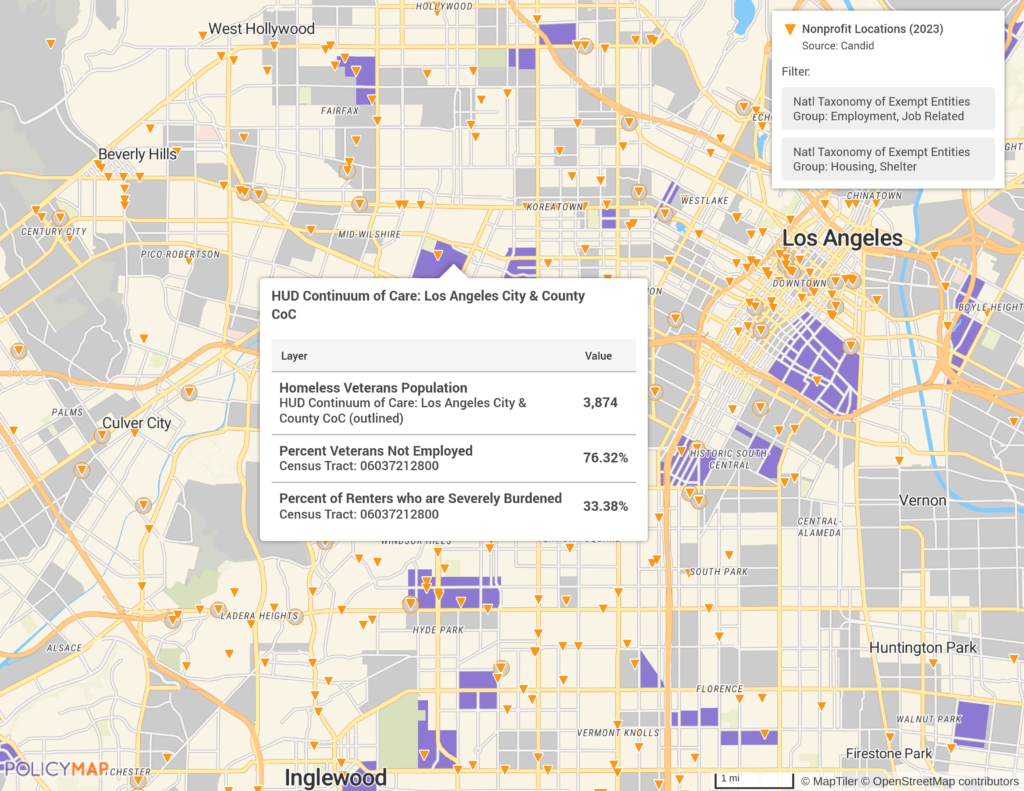
PolicyMap multi-layer maps can help users better understand within the context of their CoC. Multi-layer maps combine datasets to generate maps that meet user-set criteria. For example, the map below shows areas with the highest combination of severe rent burden, veterans not employed, and veterans facing homelessness in tracts within Los Angeles. The orange icons simultaneously display the locations of nonprofits that specialize in employment or housing.

Creating multi-layer maps can be useful in visualizing resource gaps, exploring the correlation between homelessness and other social determinants of health, seeking potential opportunities for collaboration, and so much more.
Request More Information
Learn how you can access this crucial information. Fill in the more below to request more information about data from HUD available through PolicyMap to gain insights and drive impactful change in your community.
- According to HUD, “The one-night PIT counts are typically conducted each year during the last 10 days of January. However, in 2022, because of concerns surrounding the COVID-19 (Coronavirus) health emergency, 145 CoCs (more than one-third) received waivers to conduct the PIT count in late February or early March instead of the last 10 days of January…In 2023, all but seven (of 381) CoCs completed the PIT counts during the last 10 days of January.” ↩︎