Data and Community Health
Understanding neighborhood conditions is essential to keeping people healthy and cutting medical costs.

When it comes to our health, perhaps the greatest predictor of how long we’ll live and how much it will cost to keep us healthy is the place on the map where we live – the home, the neighborhood, the zip code.
To understand the non-medical factors — the social determinants of health — you need data. Data comes from a host of sources: national datasets (such as the Census and the CDC), national and local analyses, and de-identified patient data.
How can state agencies and health providers use data on maps to improve community health outcomes and reduce costs?
WHITE PAPER
Do our zip codes need to determine our health?
Perhaps the greatest predictor of our health is where we live. Learn five ways to use data on maps to improve health outcomes and decrease costs.

PolicyMap is a HIPAA Compliant Certified Small Business and Benefit Corporation.
CUSTOMER STORY
Northwell Health
Is a network of collaborators, researchers, entrepreneurs and educators that focuses on both individual patient-level care and broader community health. Their Community Health department is developing new tools using geospatial analysis and mapping with PolicyMap to better understand the communities they serve, and better connect individuals to accessible community-based resources.
One of the reasons we looked into PolicyMap [as a base] for our Social Vulnerability Index is that you already have such a variety of curated datasets. We use your Custom Regions tool to visualize customizable service regions for our team.
– Assistant Vice President, Community Health, Northwell Health
WEBINAR
Treating the Whole Community: Addressing Social Drivers of Health
Health care providers and government agencies can benefit from knowing more about the communities they serve. They can address issues unique to low-income patients and other groups with specific needs, improving outcomes and lowering medical costs. Using a data-driven approach to public health, they can successfully implement targeted health interventions, while lowering costs. For this Mapchats webinar, we heard from two practitioners and researchers who talked about ways that they’re using community level data to improve public health: Sarah Dixon from the Iowa Primary Care Association and Amy Carroll-Scott from Drexel University’s Dornsife School of Public Health.
Case Study Videos
Watch short case studies on how to use data and maps to solve health problems in your community.
Data for Improving Community Health
PolicyMap contains a wide variety of community level health data, to help you improve health outcomes and cut medical costs. Click on an indicator to see it in PolicyMap.

COVID-19

Life Expectancy

Insured And Uninsured Populations

Opioid Use

Race & Ethnicity

Healthy Food Access

Healthcare Access

Family Types

People With Disabilities

Medical Spending

Risk Factors*

Disease Prevalence

Community Assets

Tax Incentives
*Exclusive Data. PolicyMap’s expert data team uses advanced small-area estimate methodology to generate data at the census tract and zip code level, which gives insights into specific neighborhoods that aren’t available with county-level data available elsewhere.
See How PolicyMap Can Help Your Organization.
Contact us if you’d like to:
- View the +50,000 indicators from hundreds of sources available through PolicyMap
- Schedule a personalized demonstration and request trial access
- Better understand your community in order to solve real-world problems faced by real people in real places
On The Blog

Opioid Addiction in Your Community
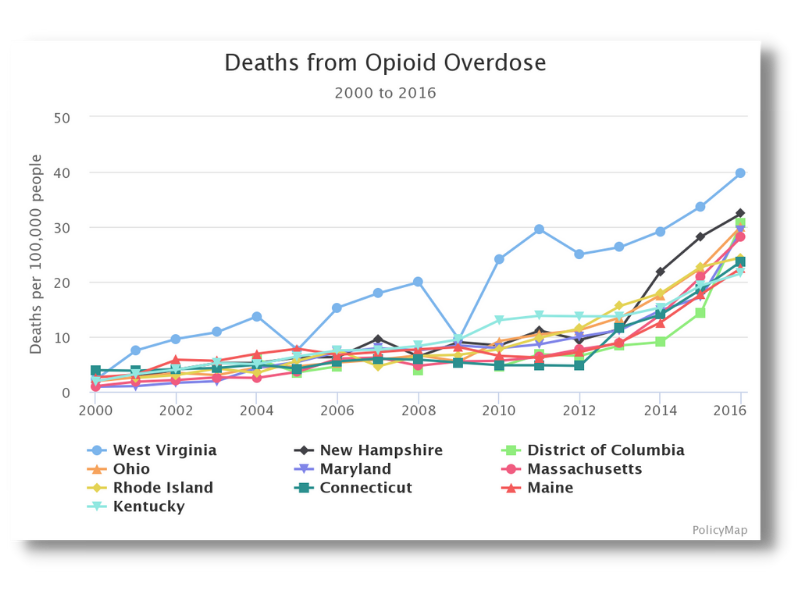
The story of opioid addiction is not simple. The data highlights how policymakers need to understand the pictures of opioid addiction in their communities.

Knowing Life Expectancy to Improve Public Health
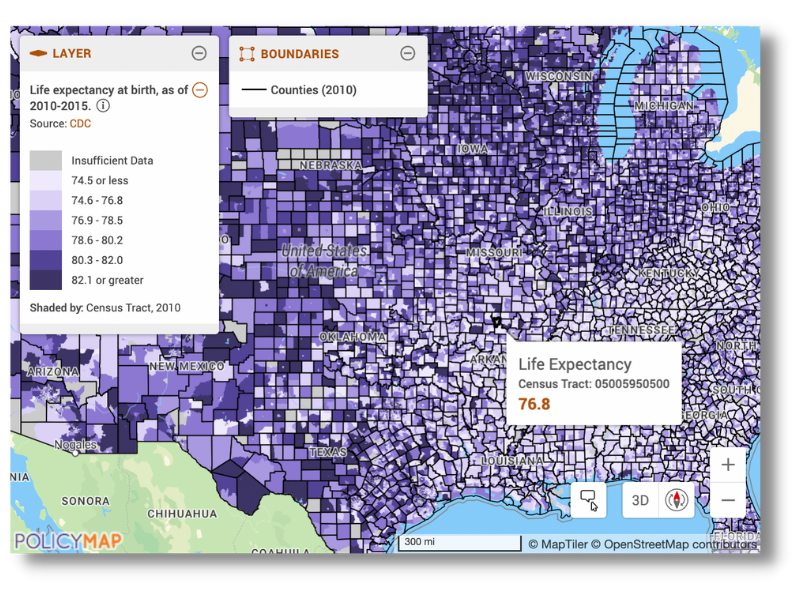
Where someone is born can predict how long they’ll live. This isn’t fate. Knowing where life expectancies are short is the first step to extending lives.

The PolicyMap Community Health Report
Place matters when it comes to health. Where someone is born and where they live can be the most significant factors in determining their overall level of well-being. To help users understand the health landscapes of their communities, PolicyMap has created a new Community Health report.
