
Reaching the Right Audience Starts with Segmentation
Segmentation isn’t just a marketing buzzword. It’s how you figure out who your customers are and how to reach more people like them. Think of it like building a playlist. You don’t just throw in every song; you group them by mood or genre. Market segmentation works the same way. Instead of speaking to everyone the same way, you identify the audience that matters most and tailor your message to match their preferences.
One of the most comprehensive segmentation systems in the U.S. is Claritas PRIZM Premier. It assigns every U.S. household to one of 68 distinct segments, based on a blend of demographic traits (like income, age, and family structure), lifestyle indicators, and consumer behaviors, including media usage and tech adoption. Segments are ranked by socioeconomic status, using variables like income, education, occupation, and home value. This flagship system operates on a proven principle that people with similar lifestyles tend to live near each other. Known as “birds of a feather flock together,” this idea powers the structure of PRIZM Premier, which also organizes segments into 11 Life Stage Groups and 14 Social Groups, offering even broader lenses for understanding audience trends.
How PRIZM Premier Works
Claritas uses a proprietary approach called Multi-Source Aggregation and Distributional Alignment (MADA) to assign households to PRIZM® Premier segments. This method pulls from the Claritas Demographic Update and combines data from several trusted sources, including Claritas Financial Track, Epsilon, Valassis, Data Axle, and TomTom. Attributes like age, income, and household composition are either self-reported or modeled to create a comprehensive profile.
Start with the Predominant Segment
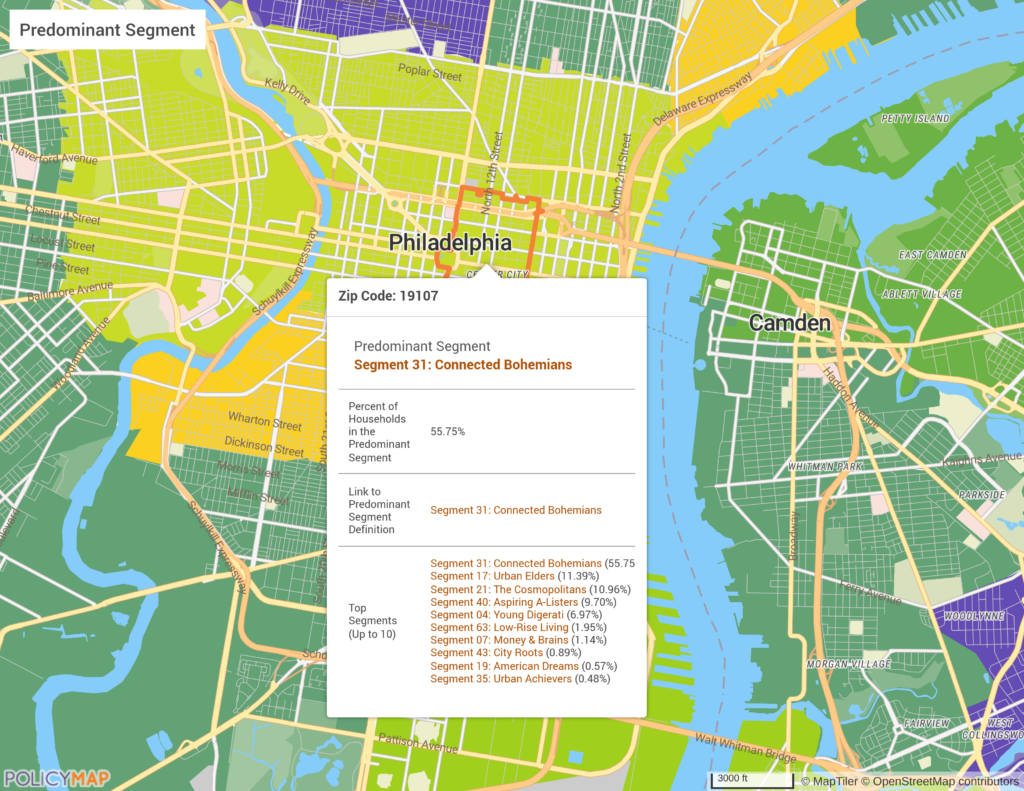
To begin exploring, select the predominant segment for your area of interest. You can search by ZIP code, city, county, census tract, block group, or even custom regions. From there, you’ll see the top 10 PRIZM Premier segments for that location. Each links to a detailed profile on the Claritas site, offering insights into household characteristics, lifestyle behaviors, and media preferences.
City center of Philadelphia, ZIP code 19107, showing the predominant segment, Segment 31 Connected Bohemians, which makes up 55.75% of households. The info bubble lists the top ten segments in this area.
What Segmentation Really Tells You
PRIZM Premier organizes U.S. households into clusters based on shared characteristics and behaviors. The system is built on the idea that people with similar lifestyles often live near each other and make similar decisions.
Claritas uses seven key drivers to assign each household to a segment:
- Household income
- Age
- Technology use (are they early adopters or still using a landline?)
- Presence of children
- Homeownership
- Urbanicity
- Income-producing assets (a more complete view of wealth beyond just income)
These factors combine to create a nuanced, actionable snapshot of every household.
Zooming Out: Broader Household Groupings
If you’re more focused on overall trends than individual segments, PRIZM Premier offers broader lenses that make it easier to compare audiences across regions. Each of the 68 segments is grouped into:
- Life Stage Groups, which groups households by age and presence of children
- Social Groups, which groups household by socioeconomic status and urbanicity
- Demographic Groupings, which offer a high-level view based on core traits like income, age, and household composition
These categories offer high-level context that helps you spot patterns without needing to drill all the way down to the segment level.
There are 11 Life Stage Groups, which fall into three overarching categories:
- Younger Years: Mostly under 45, often singles or child-free couples
- Family Life: Typically households with children, ages 35 to 54
- Mature Years: Usually age 55 and up, including empty nesters and older singles
Predominant Life Stage Group in this ZIP code is Younger Years: Midlife Success, accounting for 74.16% of households. The low presence of Family Years segments shows this area is mostly made up of younger adults, with about 14% of households in the Mature Years group.

Why It Matters
Segmentation helps you identify your best customers, understand their needs, and deliver messages that resonate. It’s not just about finding new audiences, it’s about reaching the right ones, through the right channels.
This approach changes the game. Instead of spreading your budget thin and hoping your message lands, you focus on the people most likely to respond. It’s more efficient and far more effective.
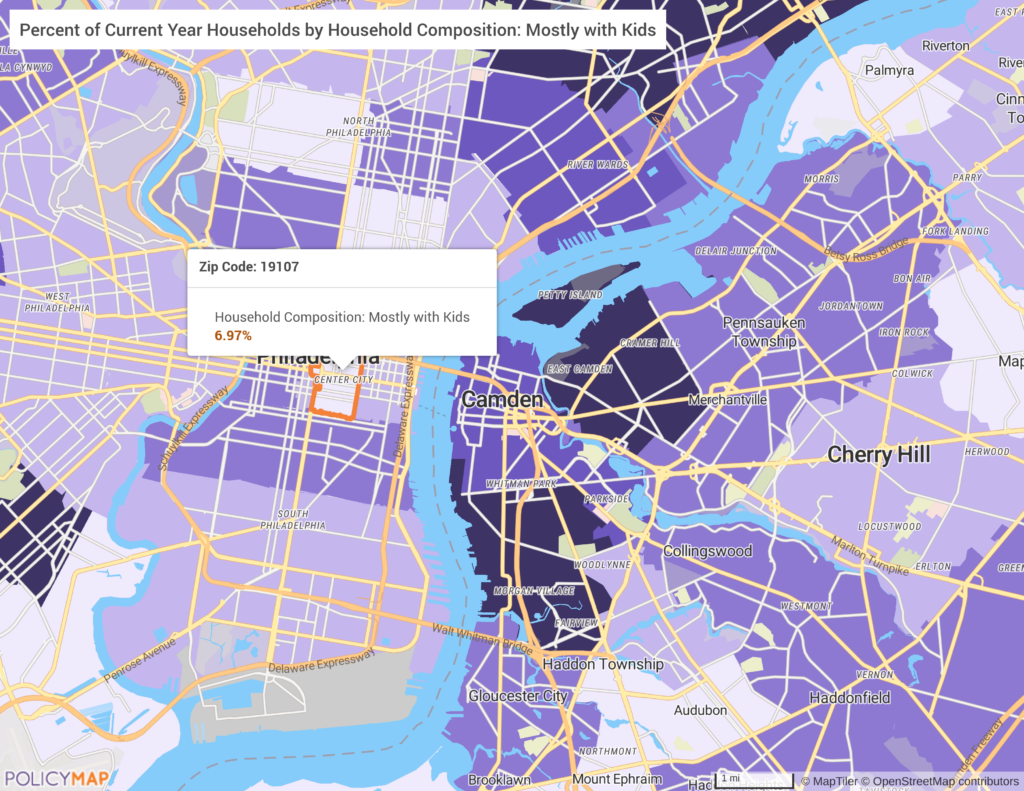
For example, a children’s clothing brand might target families with kids aged 2 to 12 who shop seasonally. Using segmentation, you can find similar households and tailor your outreach to match their habits.
Households with children are less concentrated in the city center. Areas to the north and across the river show higher concentrations, highlighted in deeper purple. These neighborhoods may be better targets for family-focused outreach.
Segment in Action: Young Digerati
Take Segment 4: Young Digerati. These households tend to be young, affluent, tech-savvy, and heavy media users. They’re likely to stream alternative music, read sites like The Atlantic, and try new devices early.
If this segment is concentrated in your area, you might run ads on niche podcasts or serve mobile ads in geo-fenced neighborhoods where they live. That’s much more targeted and more effective than casting a wide net with traditional media.
Our original 19107 ZIP code only includes 661 households in Segment 4: Young Digerati. Just one ZIP code over, that number jumps to 1,494. If this segment is your target audience, the neighboring area may offer a stronger concentration for outreach.

Harnessing Multi-Layer Maps for Smarter Decisions
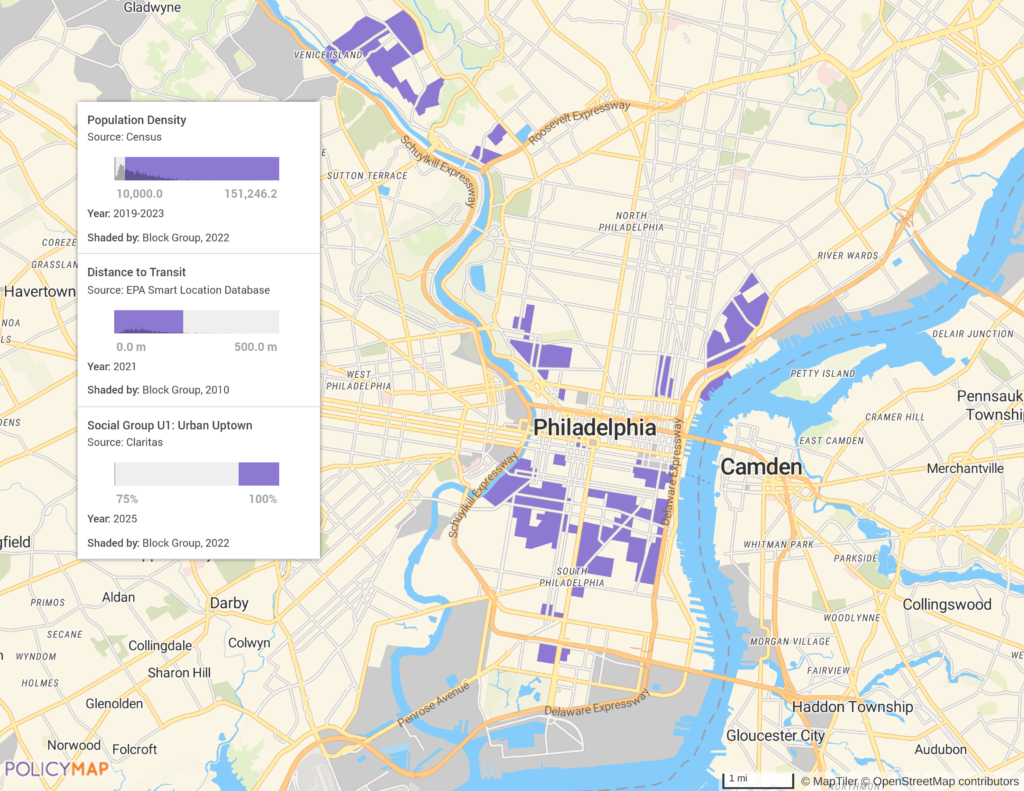
PolicyMap lets you combine Claritas consumer segments with its vast library of datasets, including employment, housing, education, and household trends. This multi-layer approach reveals patterns and opportunities that help make informed decisions tailored to your specific business or community needs.
For example, if you’re targeting Social Group U1: Urban Uptown, layering population density and transportation data shows not just where they live but how easily they can reach your business. Even a high concentration of your audience won’t help if transportation options are limited. Multi-layer maps help you find locations with the right customers, enough people, and easy access.
Turn Segments into Strategy
Claritas data powers smarter strategies across industries. Segmentation helps you understand who your audience is, how they live, and what drives their decisions—so you can communicate more effectively and make better-informed choices.
It’s not just for marketers. Libraries use segmentation to guide community programming. Researchers and business schools use it to analyze consumer behavior. No matter the context, segmentation helps you tailor your message and delivery to match real-world demographics and lifestyle patterns.
Here’s how it helps:
- Target outreach and services to the households most likely to engage
- Shape messaging and content around how people live, work, and communicate
- Support program planning, resource allocation, and strategic research across industries
Claritas PRIZM® Premier offers the data and structure to reach the right people, with the right approach, in the places that matter most.
Request More Information
Explore predominant segments, social groups and life stage groups at a local and national level. Fill in the form below to request more information about new Psychographic Data from Claritas PRIZM®.