Monitor Pandemic-Related Education Setbacks This Fall Using School Tracker Data

Back-to-school preparations for this year carry a mix of optimism, trepidation, and concern about children’s setbacks exacerbated by the pandemic. As the pandemic shows no signs of abating, many of us are wondering if the spread of the delta variant of the virus will necessitate a return to remote learning this fall and, if so, which communities are at greatest risk of exacerbated inequalities. To answer these questions, we’ve added new data to PolicyMap: school remote learning and reopening rates for the 2020-2021 school year, as well as weekly updates on remote/hybrid/in-person school tracker data for fall and winter 2021 as a part of our Premium and Enterprise License subscriptions. This data is provided by Burbio, Inc. Burbio is a data service that measures school and community life. The school reopening rates and tracker data is currently available at the county level, and we’ll be subsequently adding school district level calculations.
Identifying Communities at Greatest Risk of Learning Setbacks
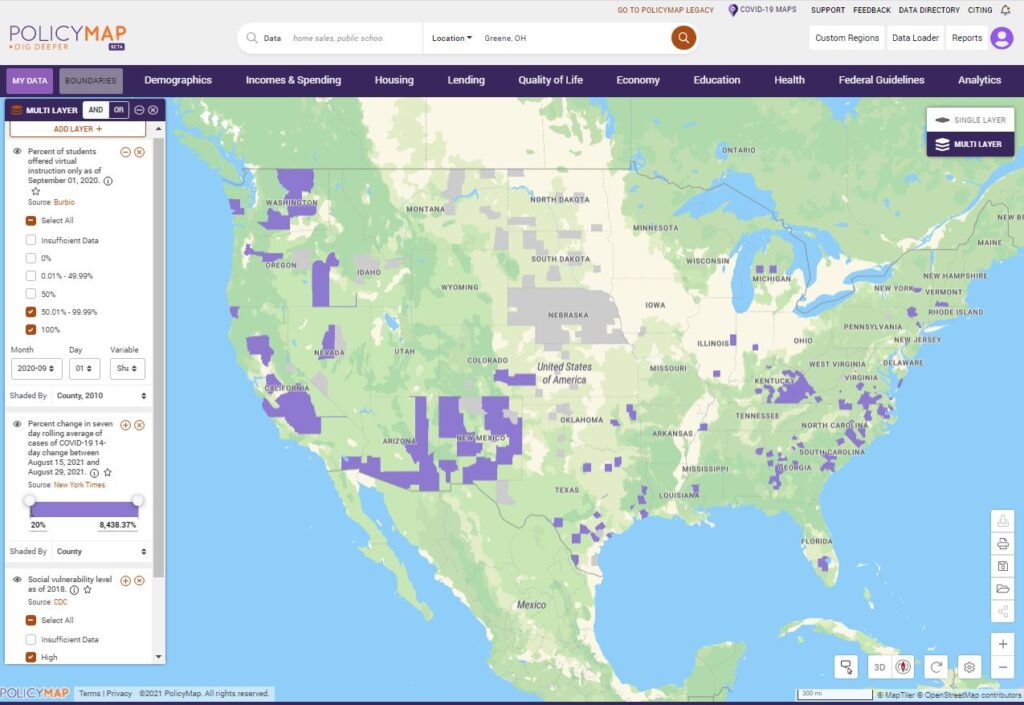
Research indicates that students, particularly those in already marginalized communities, experienced significant setbacks in learning last year as a result of the switch to remote learning. In response, some states have offered students the ability to repeat their grade; others are requiring students to do so if they fail standardized tests. But if the Delta surge forces schools to return to remote learning yet again, what then? City and school district officials, education advocates, and policymakers at all levels of government need to know which communities are in greatest need of resources to ensure existing inequities aren’t exacerbated this school year. With this new dataset PolicyMap can help identify communities likely experiencing losses in learning and socializing after a year or more of remote learning. To do so, subscribers can combine data on PolicyMap about last school year’s remote schooling rates, current COVID hotspots (updated daily), and social vulnerability to triangulate communities with children at greatest risk of additional learning setbacks in fall 2021.

Ongoing Monitoring of Potentially Vulnerable Communities
With the new school tracker data on PolicyMap, practitioners can also monitor communities this fall that become newly vulnerable to learning setbacks due to pandemic-related school closures. And likewise, researchers can use the school remote learning and reopening rates data to track school performance and school enrollment patterns over time synced with school reopenings and school closures.
For more information about how to use PolicyMap’s new proprietary data in your education-related work, contact us.