Where Neighborhoods Provide Opportunity

Data
Opportunity Insights
Source
Census and Opportunity Insights
Find on PolicyMap
- Incomes & Spending
- Income
- Income by Place of Childhood
- Income by Place of Childhood – Stayed in Same Metro Area
- Quality of Life
- Criminal Justice
- Incarceration Rates by Place of Childhood
Policy makers on both sides of the aisle agree that people should have the opportunity to lift themselves into a higher income class than they were born into, regardless of their background. This might be through getting an education, starting a new business, or finding high quality employment.
Unfortunately, opportunities for economic mobility don’t always exist. Public education may be under-resourced, extreme poverty limits access to capital or leeway to take risks, and the local economy often doesn’t provide high-quality jobs. Poverty can be so entrenched that any improvement in life may be unthinkable.
Opportunities don’t always exist. But sometimes they do. These opportunities often depend on where someone was raised. While lower poverty rates and higher school quality play a role, opportunity is more accessible in places where more people have stable employment and a stable family structure. This is according to recent research from Harvard University’s Raj Chetty and a team of researchers from Harvard, Brown, and the Census Bureau.
Their research shows that someone born into a low-income family can have very different prospects depending where that family lives. A child born into a very-low income family in Memphis, Tennessee, forty years ago, makes, on average, $22,637 annually today. Compare this with a child born into a very-low income family in Dubuque, Iowa, who today makes, on average, $46,089. Same childhood family income, vastly different adulthoods.
And differences don’t just exist between cities. Growing up in different neighborhoods in the same city can lead to very different outcomes. A child born in a very-low income family in the Englewood neighborhood of Chicago today makes an average of $19,529. If that child was born seven miles away, in Archer Park, still in a very-low income family, today they would be making an average of $44,805.
This data comes through Opportunity Insights, a team of researchers based out of Harvard, directed by Raj Chetty. They conducted a longitudinal study, linking Census data from 2000 and 2010, ACS data from 2015, and tax returns from 1989 through 2015. You can read more about how this data was created here.
The data shows the household income that someone born between 1978 and 1983, who grew up in a given area on the map, is earning today. The map doesn’t represent current incomes – those people may have moved across the country. It shows the opportunity provided by the places they grew up.
What insights can people take from the data? One common argument is that low-income families should attempt to move from low-opportunity areas to high-opportunity ones. Unfortunately, moving costs, lack of housing, and local connections might make this difficult for a low-income family to accomplish.
Policy makers can take steps to help, though. One solution could be to encourage the development of affordable housing in high-opportunity areas, so low-income families can take advantage of the resources they offer.
High-opportunity areas are often high-income areas, but this isn’t always the case. Comparing this data to Census income data, we can find neighborhoods that have historically provided more opportunity, despite having lower- or middle-income residents.
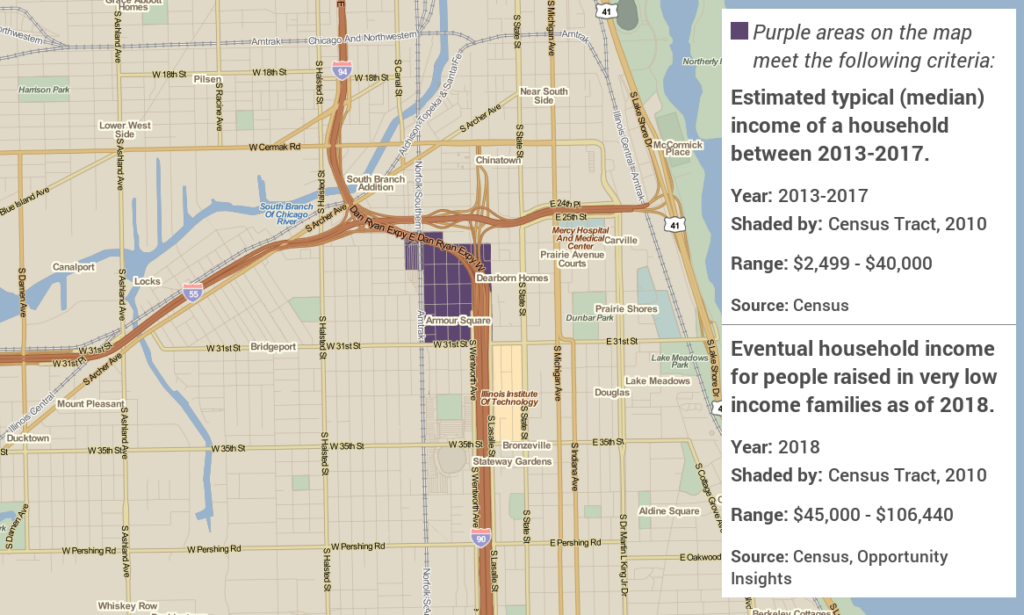
In sections of the Bridgeport neighborhood of Chicago, the median household income is $32,321. But children from very-low income families who grew up in that neighborhood today make an average of $50,124.

The reasons for this are likely complex, but it’s worth noting that the area, the onetime home of five Chicago mayors, has historically held political clout, opening opportunities for all sorts of city jobs. On a darker side, it was also once considered a hotbed of racism, though it’s become much more diverse in recent years.
Can the opportunities that made Bridgeport such a beneficial place to grow up be replicated elsewhere? What neighborhoods have similar advantages in other cities? This data provides an entry point to answering these questions.
More about the data
The Opportunity Insights economic mobility data is available in the Incomes & Spending menu of PolicyMap, under “Additional Data”, “Income by Place of Childhood”.
A large number of useful breakdowns exist. You can look up the eventual incomes for children who grew up in very low, low, and medium income families. Because opportunities aren’t always equally available for populations of color, you can look at the eventual incomes specifically for individual races, as well as individual sexes.
The data can also be limited to just individuals who never left their hometown (living somewhere in the metro area they grew up in). This would help identify what areas are benefiting (or not) from the opportunities it provides its residents.
The data also offers a different look at life outcomes, showing the eventual incarceration rates for people raised there in very low, low, and middle income families. This data is available in the Quality of Life menu, under “Criminal Justice”, “Incarceration Rates by Place of Childhood”. The same breakdowns by family income, race, and sex are available.