
Visualizing Urban Inequality: The Cost of Environmental Injustice in Our Cities

The Home Owners Loan Corporation (HOLC) was a government-sponsored corporation established in 1933 as part of the New Deal. The corporation engineered long-term disinvestment through Redlining. This discriminatory mortgage appraisal practice had a powerful impact on urban centers, especially areas predominantly populated by people of color and immigrants. After labeling communities as ‘Declining’ and ‘Hazardous,’ neighborhoods faced a myriad of challenges, such as a lack of quality schools, grocery stores, parks, and transportation.
Nearly a century later, the challenges faced by historically redlined neighborhoods persist. Despite the Fair Housing Act of 1968 and the Community Reinvestment Act of 1977, which prohibited redlining and aimed to improve access to credit, governments at all levels have played a well-documented role in perpetuating and exacerbating these injustices. Land use policies and zoning regulations discouraging investment, lowering property values, and weakening the tax base have caused chronic housing and infrastructure decay, limiting access to quality food, education, and economic opportunities.
However, recent advocacy, community-driven investments, and legal victories have paved the way for community renewal and success. For example, the Justice Department boasted a major feat in the fight for environmental justice with its landmark Combatting Redlining Initiative, a $107 million deal aiming to promote fair access to credit, enforce fair lending, and facilitate community reinvestment initiatives. In the past year, the country has seen substantial federal investments in clean energy, sustainable housing, and workforce development geared toward benefiting disadvantaged communities (DACs). Such initiatives include the Inflation Reduction Act, the Justice40 Initiative, and the $27 billion Greenhouse Gas Reduction Fund (GGRF).
Stakeholders at all levels can leverage PolicyMap’s data-driven insights to identify chronically underserved areas and assess the impact of targeted interventions over time to promote equitable development and mend long-term damage caused by redlining.
The Built Environment and Health Inequities
The physical neglect of historically redlined neighborhoods, combined with poor environmental regulation and negligence by officials, has led to profound health impacts on residents. In many cities, BIPOC communities have higher risks of pulmonary and cardiovascular disease, nutritional deficiencies, and diabetes.
According to Brookings, Black renters and homeowners also experience higher levels of energy insecurity compared to white households. This insecurity means Black renters are more likely to struggle with paying energy bills, to sacrifice essential expenses like rent or groceries, or to keep their homes at unsafe temperatures. Researchers found that energy insecurity is a dangerous consequence of climate vulnerability. It increases the financial burden of staying cool, elevates the risk of heat-related illnesses and fatalities, undermines efforts to build wealth, and negatively affects overall well-being.
Historically, polluting industries often targeted areas where land was cheap, and cities compounded this by zoning already vulnerable communities for industrial use. The lack of environmental protection in these areas resulted in poor air quality and other environmental hazards, contributing significantly to the poor health outcomes observed in these communities.
Indicators and Inequalities Visualized: Toledo, OH
Toledo, OH serves as an insightful and cogent case study for environmental justice indicators in American cities. Toledo has experienced a variety of environmental burdens in the last decade, from harmful algae blooms to urban heat islands. Sixty-six percent of the census tracts that comprise the city are designated as “High” on the Environmental Justice Index rank, meaning that tracts face more severe impacts relative to others nationwide.1 Sixty percent of tracts classified as such also have a majority population of color, while less than 40% of Toledo’s residents are BIPOC.2
Linking Historical Disadvantage
The map below visualizes block groups in Toledo, shaded by the percent of the population that is people of color. PolicyMap uses different gradient colors to represent block groups based on their statistical differences within a dataset. In the image below, block groups with a BIPOC population of 50% or greater are selected.
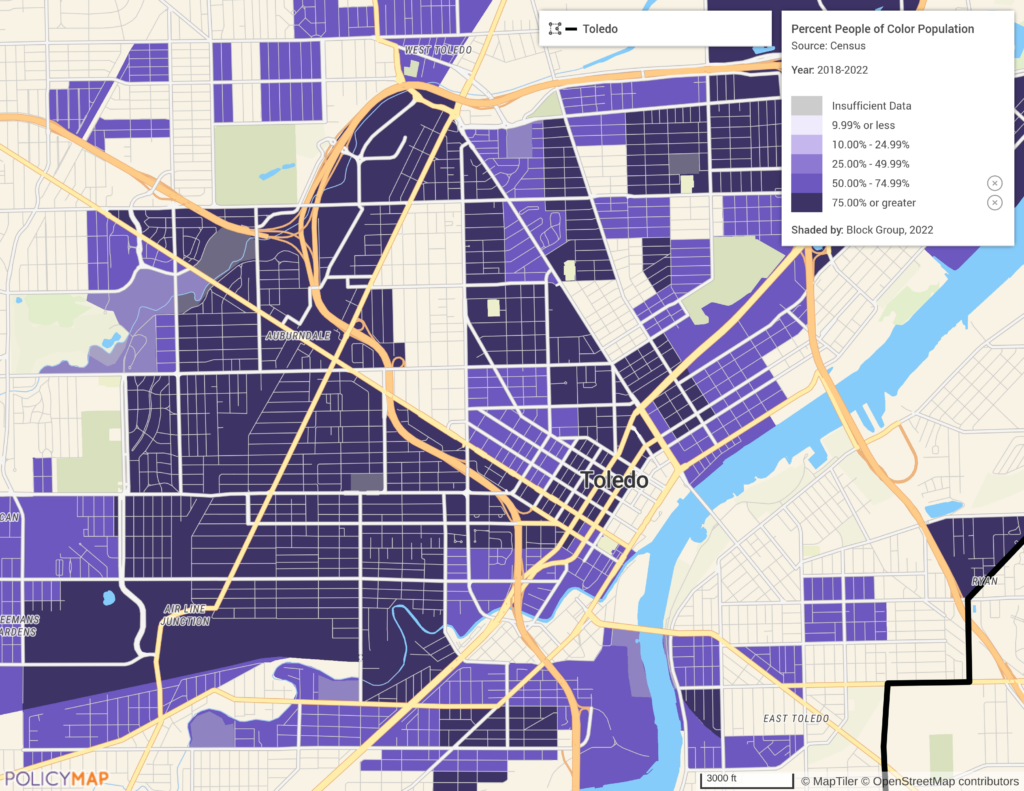
Brownfield properties are sites where the actual or potential presence of hazardous substances, pollutants, or contaminants complicates and increases the cost of redevelopment. They have been included on this map also to visualize the relationship between the proliferation of sites and neighborhoods with a BIPOC population of 50% or more.

HOLC ratings of “Hazardous” neighborhoods are also outlined in red, accenting a historical context for environmental justice indicators. These redlined areas were deemed “high-risk” for mortgage lending, leading to systemic disinvestment and a serial displacement of capital for these communities. Community stakeholders and government officials can utilize the PolicyMap platform to overlay historic boundaries to better assess historical context during analysis. Note that redlined neighborhoods in this map frequently have a current BIPOC population of 50% or greater and are often adjacent to highways, further illustrating the association between history, the built environment, and race.

Linking Race, Environmental Determinants, and Low Life Expectancy
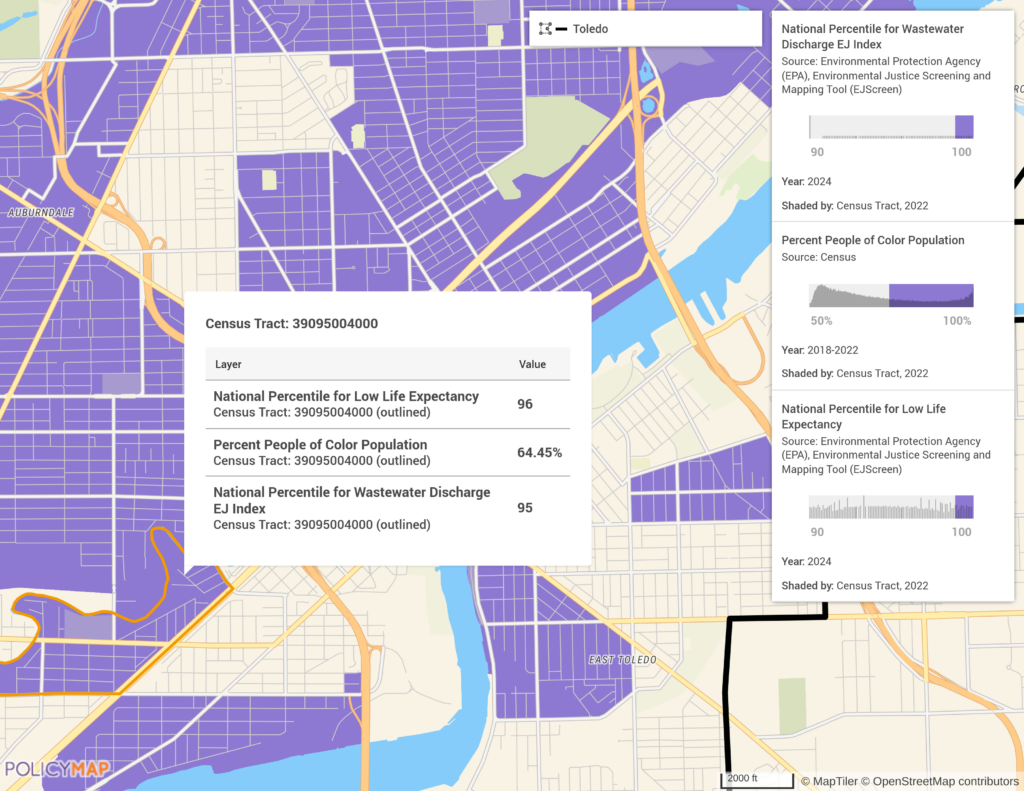
A more pointed investigation of environmental and health determinants through specific indicators included in the Environmental Protection Agency’s Environmental Justice Screening and Mapping Tool (EJScreen) highlights how the built environment and public health are frequently intertwined. The data selected below includes the Percent People of Color Population and two other critical indicators: National Percentile for Wastewater Discharge and National Percentile for Low Life Expectancy. The latter two measures, both set to the 90th percentile, relative to all census tracts nationwide, reveal the correlation between race, exposure to environmental determinants, and the potential for low life expectancy. While the National Percentile for Low Life Expectancy incorporates a variety of indicators, exposure to wastewater has been shown to negatively impact long-term health. Empirical indicators of this sort should be considered by stakeholders to ensure proper interventions for at-risk populations.
Environmental and Economic Justice
Additionally, when analyzing environmental injustice data, economic factors like income, particularly in low-income areas, highlight communities in need. For analysis of two or more data layers, PolicyMap users can create multi-layer maps to isolate granular insights.
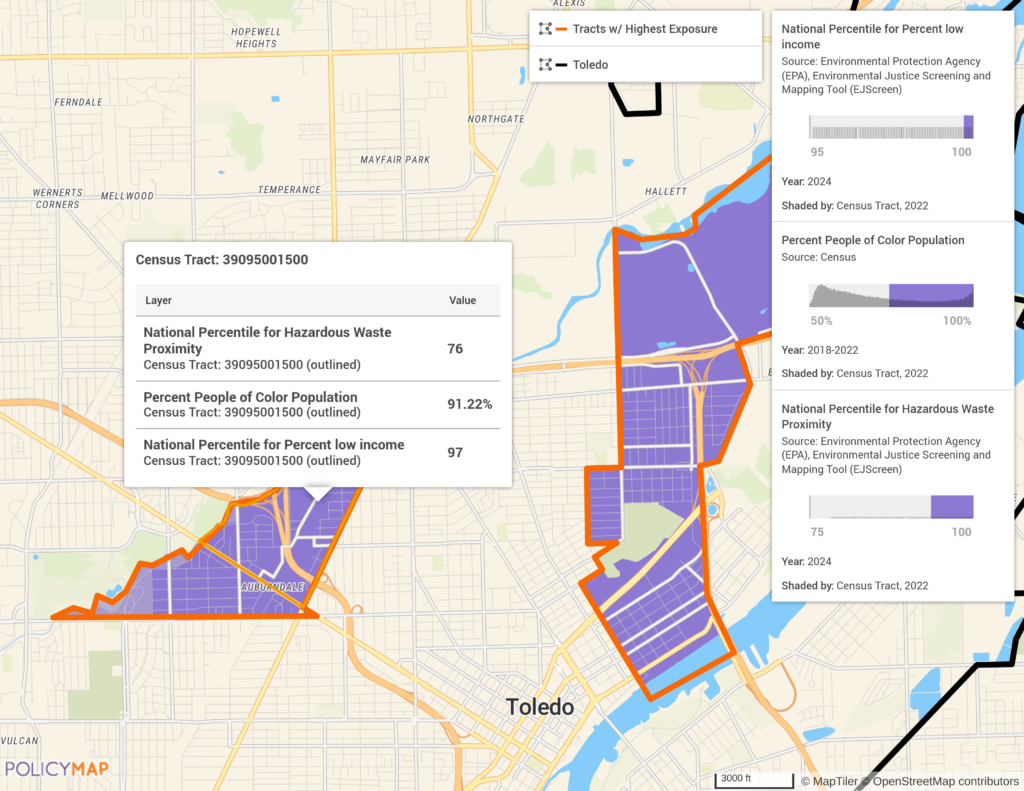
The map below layers census tracts where 50% or more of the population is BIPOC, the National Percentile for Low Income, and the National Percentile for Hazardous Waste Proximity, visualizing more acute and precise markers for social determinants of health analysis. This unique multi-layer feature allows users to instantly see where residents are of lower socioeconomic status and may be well exposed to hazardous waste sites, such as abandoned industrial facilities, landfills, and chemical storage facilities. The percentiles shown are modified to concentrate on tracts that experience the greatest degree of economic disadvantage and have the highest exposure to hazardous waste (95% and 75% respectively). Properly addressing the needs of communities necessitates specialized approaches that account for both economic and public health vulnerabilities.
A Path Forward
As historical systemic and structural racism has had a significant impact on community development, addressing environmental justice will require taking action in a variety of sectors, including economics, public health, and planning. There are strong implications for redlining on social determinants of health and community outcomes, and there has been a major focus of the federal government along with national and local public/private partners to reinvest and improve public health in disadvantaged neighborhoods. Data show that Black voters are more concerned about environmental policies and the impacts of climate change as well as are less polarized and at a higher likelihood to take political action, relative to other demographic groups in the United States. PolicyMap’s data insights on social determinants of health, economic indicators, and environmental factors help identify and analyze the effects of environmental injustices as well as develop strategies to enable community prosperity across the United States.
Request More Information
For more information on how PolicyMap can help identify chronically underserved areas and assess the impact of targeted interventions, please contact us using the form below. A member of our team will be in touch shortly.
- “Environmental Justice Index (EJI) rank.” PolicyMap (based on data from CDC & ATSDR: Data downloaded from https://onemap.cdc.gov/portal/apps/sites/#/eji-explorer), 2024, www.policymap.com.
↩︎ - “Estimated percent of the population that is people of color, between 2018-2022.” PolicyMap (based on data from Census: US Bureau of the Census, Decennial), 2024, www.policymap.com. ↩︎