|
|
|
|
|
|
|
|
|
FEATURED POST |
|
|
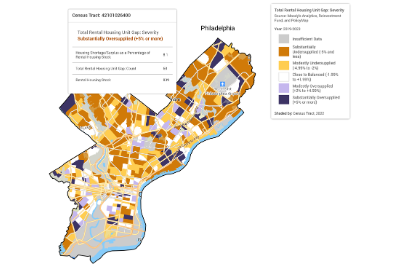
How We Used the Moody’s Analytics Housing Gap Data to Craft a $2 Billion, 30,000 Unit Housing Plan in Philadelphia
Philadelphia’s $2 billion HOME initiative takes a data-driven approach to solving the city’s housing crisis, targeting the creation and preservation of 30,000 units. With housing gap estimates from Moody’s Analytics, PolicyMap, and Reinvestment Fund guiding every step, the plan aligns funding, location, and affordability with precision. See the data that is driving real-world change in one of America’s most housing-challenged cities.
|
|
|
|
|
|
 |
|
|
IN THE NEWS |
|
|
 |
|
Will Investors Ever Believe Trump’s Threats Against Powell?
The New York Times’ DealBook newsletter, covers groundbreaking new research from Moody’s Analytics, PolicyMap, and Reinvestment Fund, which reveals that the imbalance between the nation’s housing demand and supply is much more localized than the national numbers and public dialogue suggest.
Read More |
|
 |
|
Housers on the Housing Shortage
On the latest Inside Economics podcast, Moody’s Analytics’s Mark Zandi and Cristian deRitis are joined by Ira Goldstein from the Reinvestment Fund, Maggie McCullough from PolicyMap, and Jim Parrott from the Urban Institute to discuss their new study that takes a deep dive into understanding the nature of the decade-long housing shortfall.
Listen Now |
|
 |
|
New PolicyMap and Moody’s Analytics Report Reveals Neighborhood Level U.S. Housing Shortage Analysis
Where exactly is the housing shortage hitting hardest? A new neighborhood-level analysis from PolicyMap, Moody’s Analytics, Reinvestment Fund, and Urban Institute uncovers a two million–unit gap—showing not just how many homes are missing, but where, for whom, and what kind.
Read More |
|
|
|
|
|
|
|
|
 |
|
|
ON THE BLOG |
|
|
 |
|
A Geospatial Lens on the Community Reinvestment Act (CRA)
As CRA regulations evolve, so does the need for accurate, localized data to guide community investment. Learn how PolicyMap helps financial institutions meet CRA obligations by visualizing need, supporting compliance, and strengthening impact in low- and moderate-income communities.
Read More |
|
|
|
|
 |
|
 |
|
*New & Exclusive Data* – Housing Gap Estimates from Moody’s Analytics, PolicyMap, and Reinvestment Fund have been added to PolicyMap. The Housing Gap Estimates use American Communities Survey data to estimate the level of units of housing, both owner and renter, a given census tract is short. Data is available for the most recent 5 year ACS period (2019-2023), and for census tracts within 350 of the largest cities in the United States.
*New Data* displaying Medicare-Accepting Provider locations from CMS, including the ability to filter to provider specialty, has been added to PolicyMap.
*New Data* – The Credit Insecurity Index data has been newly added to PolicyMap. This data from the Federal Reserve Bank of New York measures the ability of households to access mainstream credit and keep current on debt payments.
*New Data* – Claritas PRIZM® Premier is now available on PolicyMap! This detailed segmentation dataset offers insight into consumer behavior and lifestyle patterns across 68 demographic groups.
The CRA Eligibility Criteria dataset has been fully updated for 2025.
Feeding America’s Map the Meal Gap has been updated through 2023. This update now includes food insecurity data disaggregated by race/ethnicity as well as older adult and senior food insecurity at the state level.
Annual and Quarterly Home Sales data from Black Knight has been updated to 2024 and 2025 Q1.
Centers for Medicare & Medicaid Services (CMS) and Health Resources Services Administration (HRSA) – Hospital Compare: Quality of Care has been updated through 2025.
HRSA Hospitals and Nursing Facilities point datasets have been updated through 2025. This update expands the offering to include four new datasets: Home Health Agencies, Mental Health Services, Federally Qualified Health Centers, and a broader “Other Facilities” category, which features filterable types such as Rural Health Clinics and Hospice Centers.
We are committed to our promise of curated, cleaned, standardized, and always updated data. We’re posting real-time updates on our website, LinkedIn and BlueSky.
|
|
|
|
 |
|
Published Research
Explore scholarly works from students and researchers using PolicyMap.
Health Disparities After Redlining: A Comparative Analysis of Health Outcomes and Health Disparities in Richmond, Virginia and Portland, Oregon, published in Araneum: Richmond Journal of American & Global Affairs
Telehealth-Readiness, Healthcare Access, and Cardiovascular Health in the Deep South: A Spatial Perspective, published in the International Journal of Environmental Research and Public Health
Unincorporation in counties as a political determinant of health: An exploration of five states, published in ScienceDirect
Routes of Inequality and Enclaves of Exclusion: Understanding Public Transit’s Role in Race and Class Segregation and Mobility Disparities in San Antonio, Texas published in SageJournals
Open PolicyMap Training Sessions
Offered twice a week. Register here.
Level 1: Learning the basics of PolicyMap
Level 2: Learn the Data Loader, Multi-Layer Maps, and other Advanced Features
Open to non-subscribers. Course times rotate weekly. Don’t see a time that works for you?
Contact us.
|
|
|
|
 |
|
Join Us!
Back To School with PolicyMap:
New Data & Classroom Applications
An annual webinar for academic users
Monday, August 21st 2025
1:00pm – 2:00pm EST
Join us for an online webinar for academia to learn about PolicyMap’s newest data additions, including Claritas PRIZM Premier Data, Moody’s Housing Gap Estimates, Feeding America Food Insecurity Data, and more. We will highlight various classroom applications for a wide range of disciplines such as marketing, economics, social work, and urban planning.
This webinar will also provide an opportunity for a Q&A. Enhance your research and curriculum development with PolicyMap!
Register here to claim your seat!
|
|
|
|
|
|