
A Geospatial Lens on the Community Reinvestment Act (CRA)

Understanding the Community Reinvestment Act
The Community Reinvestment Act (CRA), enacted in 1977 under President Jimmy Carter, was designed to address inequalities in access to credit, particularly for low- and moderate-income (LMI) communities. By mandating that banks meet the credit needs of the communities where they operate, the CRA plays a crucial role in promoting financial inclusion and economic equality. It encourages banks to provide loans, investments, and services to underserved areas, driving local economic development through job creation and community revitalization.
For the past 15 years, there have been continued efforts to modernize CRA since the most recent overhaul of the CRA occurred in 1995 with very few updates since. The last update to the CRA brought the focus to measurable performance outcomes and introduced size-based tests for banks and emphasized tangible results. The 1995 change brought on the use of Performance Evaluation reports with updated examination procedures and new standards for assessing the bank’s CRA performance. That revision has proven over the years to help promote access to credit needs for LMI communities and people.
CRA Modernization – the Rollercoaster Ride
Efforts have been made to improve the CRA and get it up to speed to our ever-changing banking landscape. In the 2010s, the agencies introduced the Interagency Questions & Answers regarding the Community Reinvestment Act (or known as the Q&As) with the most recent update on July 15th, 2016. These Q&As provide guidance to the financial institutions on how to receive CRA credit for community development activities.
Throughout the following years, the agencies made efforts to communicate with the communities, banking institutions and various trade organizations to facilitate feedback and recommendations on modernizing the CRA, specifically with the focus on new business models and stressing the importance of access to bank branches.
In May of 2020, the Office of the Comptroller of the Currency (OCC) announced a final rule independently from the other agencies that would become effective 10/1/2020. It was a 3-year effort to revamp the CRA and in December 2021, the rule was rescinded leaving behind years of work with only remnants of their intent.
On October 24, 2023, the Federal Reserve Board, Federal Deposit Insurance Corporation (FDIC), and Office of the Comptroller of the Currency (OCC), frequently referred to as “the agencies,” issued a new Final Rule that builds on the CRA’s foundation, adapting it to reflect the modern banking landscape. These changes were set to roll out through staggered compliance dates in 2026 and 2027 but were also rescinded on April 7th, 2025. The agencies committed to continue working together to promote a consistent regulatory approach to the implementation of the CRA.
Impact and Responsiveness Review Factors
The Office of the Comptroller of the Currency maintains a list of illustrative qualifying activities, which provides examples of actions that meet the criteria set by the Community Reinvestment Act rules. While the list identifies services that may qualify, it refrains from endorsing specific financial institutions, organizations, or programs. As new activities meet the criteria, they are added to the list, ensuring relevance and adaptability.
Within the 2023 Community Reinvestment Act final rule, the regulatory agencies had established 12 impact review factors to evaluate the impact and responsiveness of a bank’s qualifying activities, particularly in community development financing. These factors assess projects that:
- Benefit or serve one or more persistent poverty counties;
- Benefit or serve one or more census tracts with a poverty rate of 40 percent or higher;
- Benefit or serve one or more geographic areas with low levels of community development financing;
- Support an MDI, WDI, LICU, or CDFI, excluding certificates of deposit with a term of less than one year;
- Benefit or serve LMI-families, or LMI-households;
- Supports small businesses or small farms with gross annual revenues of $250,000 or less;
- Directly facilitates the acquisition, construction, development, preservation, or improvement of affordable housing in High Opportunity Areas;
- Benefits or serves residents of Native Land Areas;
- Is a grant or donation;
- Is an investment in projects financed with low-income housing tax credits (LIHTCs) or New Markets Tax Credits (NMTCs);
- Reflects bank leadership through multi-faceted or instrumental support; or
- Is a new community development financing product or service that addresses community development needs for low- or moderate-income individuals, families, or households.
While these impact factors are not explicitly part of the 1995 CRA rule, they are great measures of community development activities, and many are referenced in the Interagency CRA Q&A and are aligned with the original 1995 CRA rule intentions.
PolicyMap’s geospatial analysis and visualization tools effectively address many of these community development activities, enabling stakeholders to identify opportunities for impactful community development while ensuring compliance with regulatory standards.
Digging Deeper: Visualizing CRA Activities
Using the year of US Census data and data published by the FFIEC, complimented with supportive data sources like Housing and Urban Development (HUD), Bureau of Labor Statistics, CDFI Fund, and many others allows users to evaluate their CRA activities and opportunities while maintaining consistency with CRA regulations.
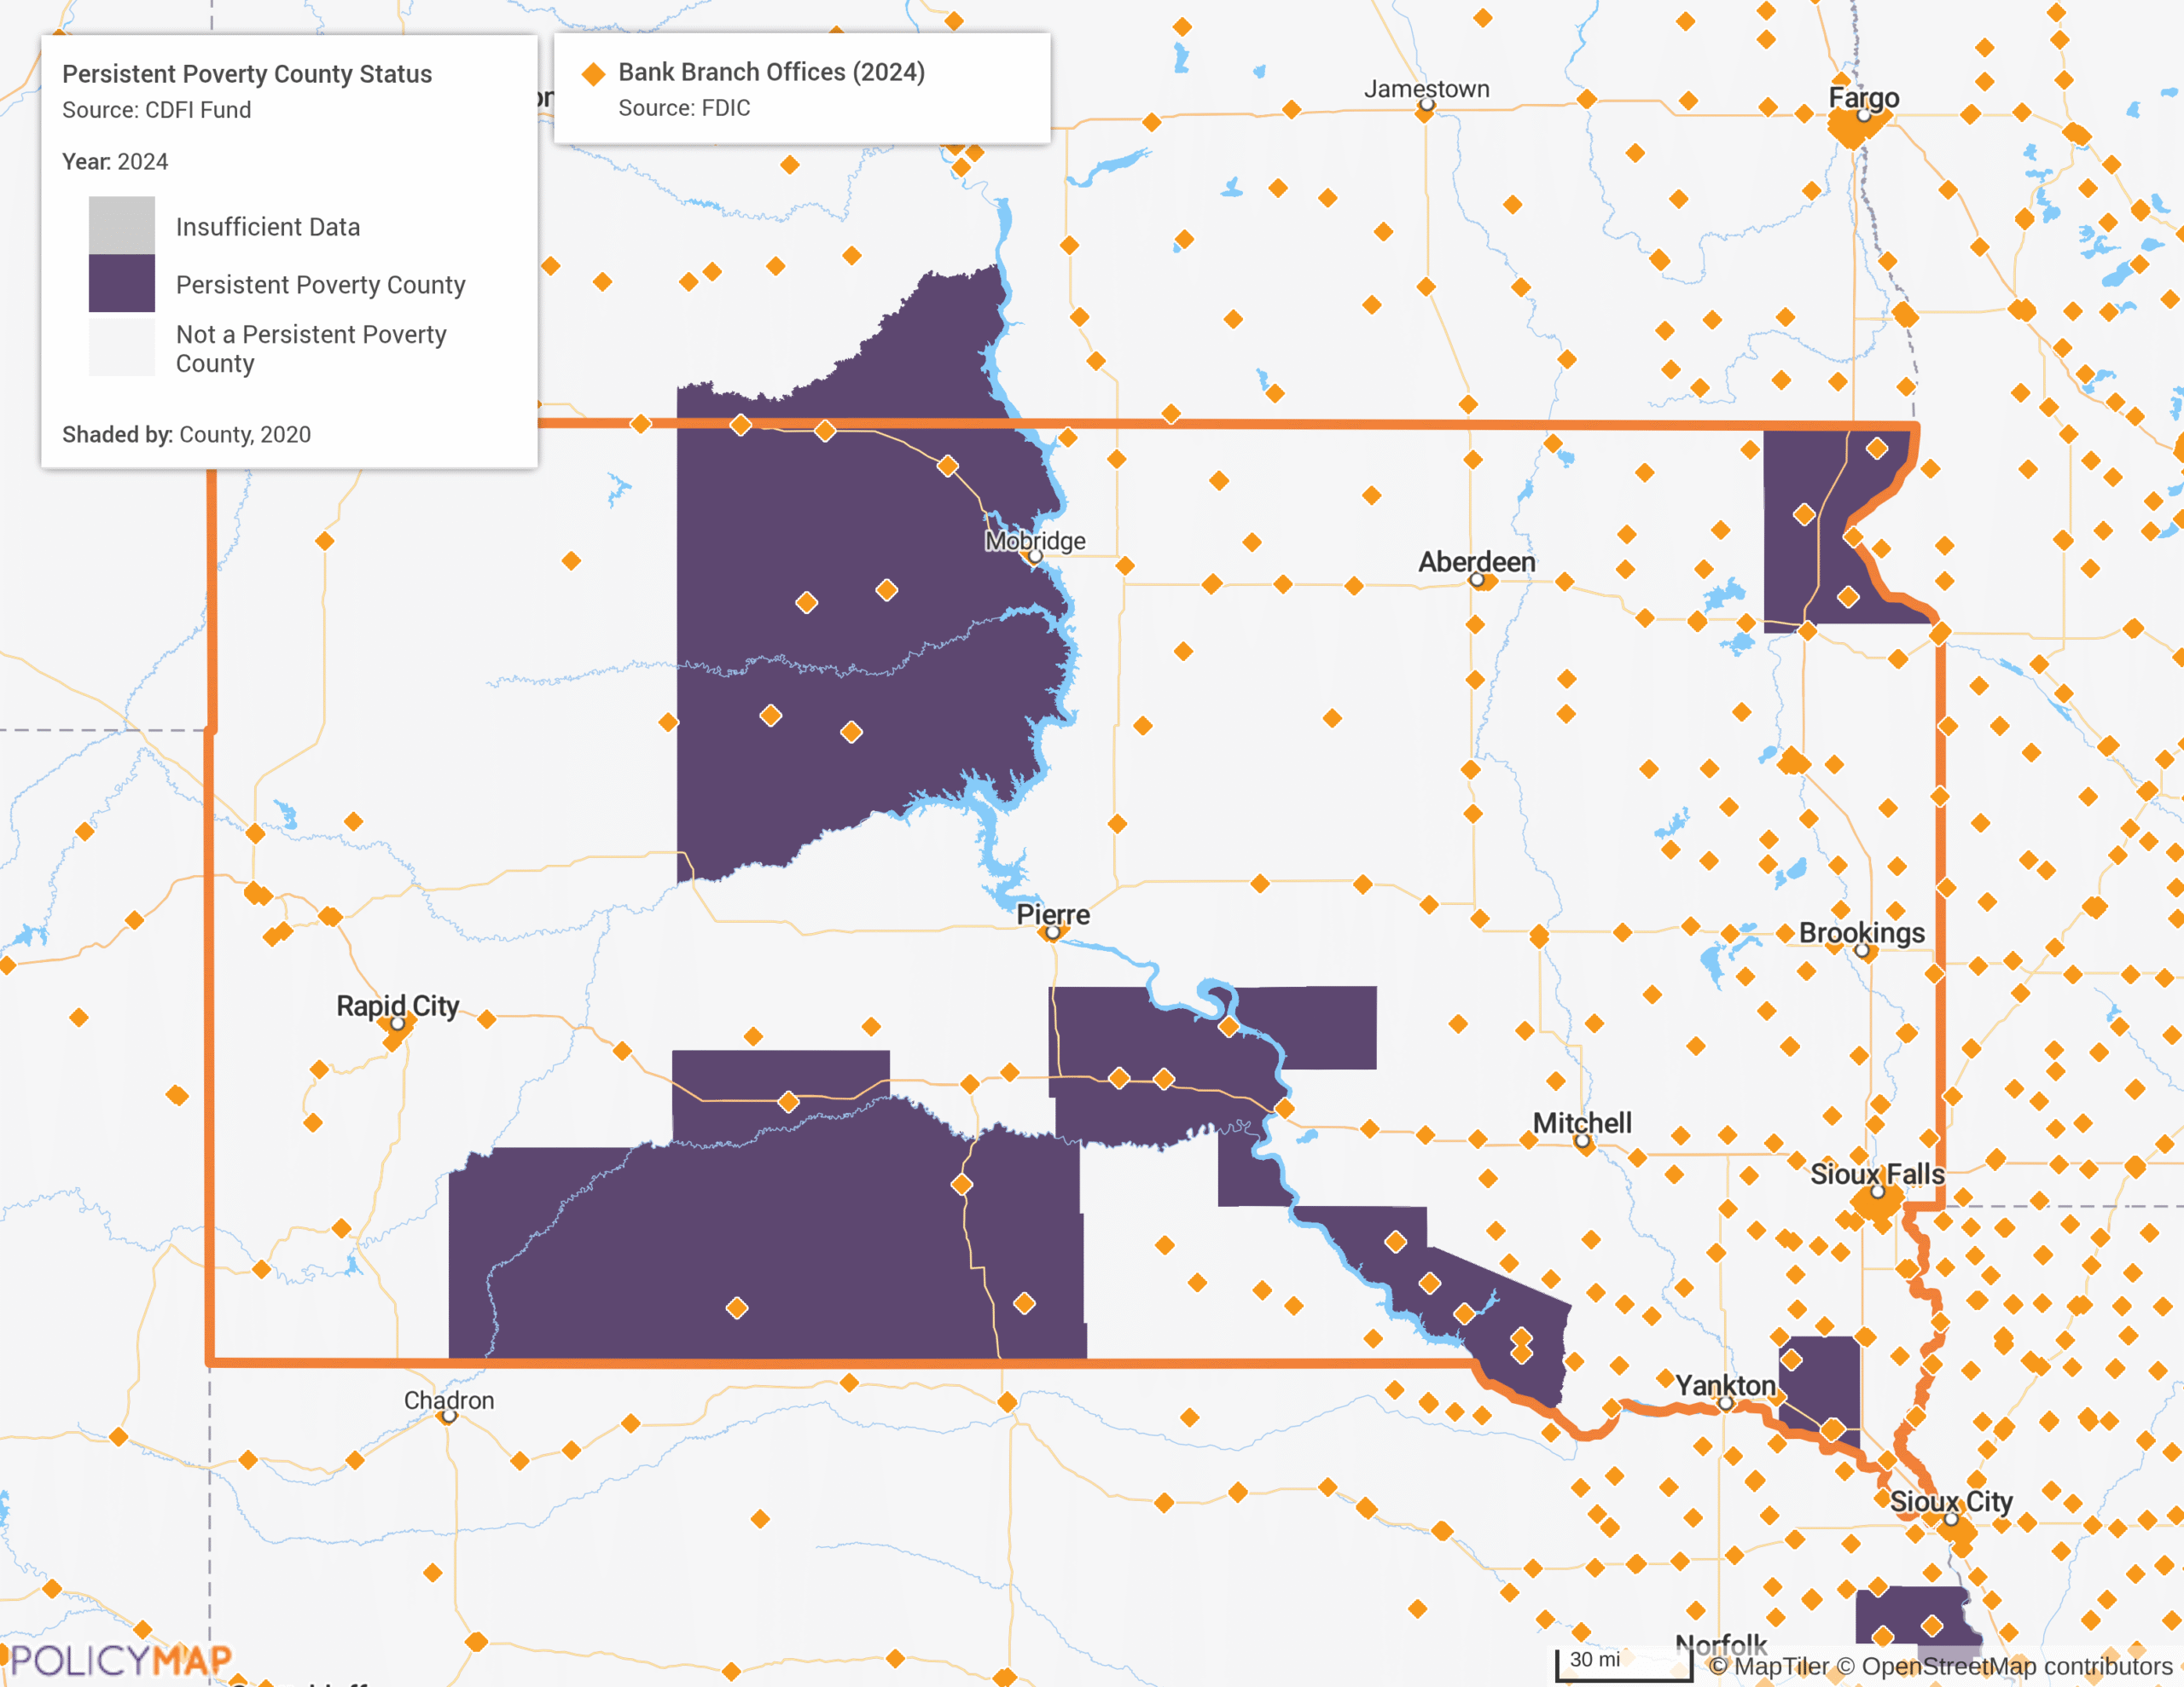
Mapping Persistent Poverty Counties in South Dakota
CRA emphasizes the importance of directing community development efforts toward the areas in the community that need it most. Culminating information about the markets in which you serve is an important part of the performance context needed to tell your CRA story. Identifying persistent poverty counties, where economic disparities have been entrenched for extended periods helps visualize the importance of banking services in those communities Using PolicyMap’s geospatial analysis tools, financial institutions can visualize and identify these counties with layers like “Persistent Poverty County Status,” sourced from the Community Development Financial Institutions (CDFI) Fund.
In the map of South Dakota below, the highlighted counties are classified as persistent poverty areas.

Locating areas facing persistent poverty enables institutions to better align their community development initiatives with a CRA plan, ensuring resources are directed to the communities that need them most.
Taking the map one step further, showing the banking locations helps drive the community’s needs for banking services even further.
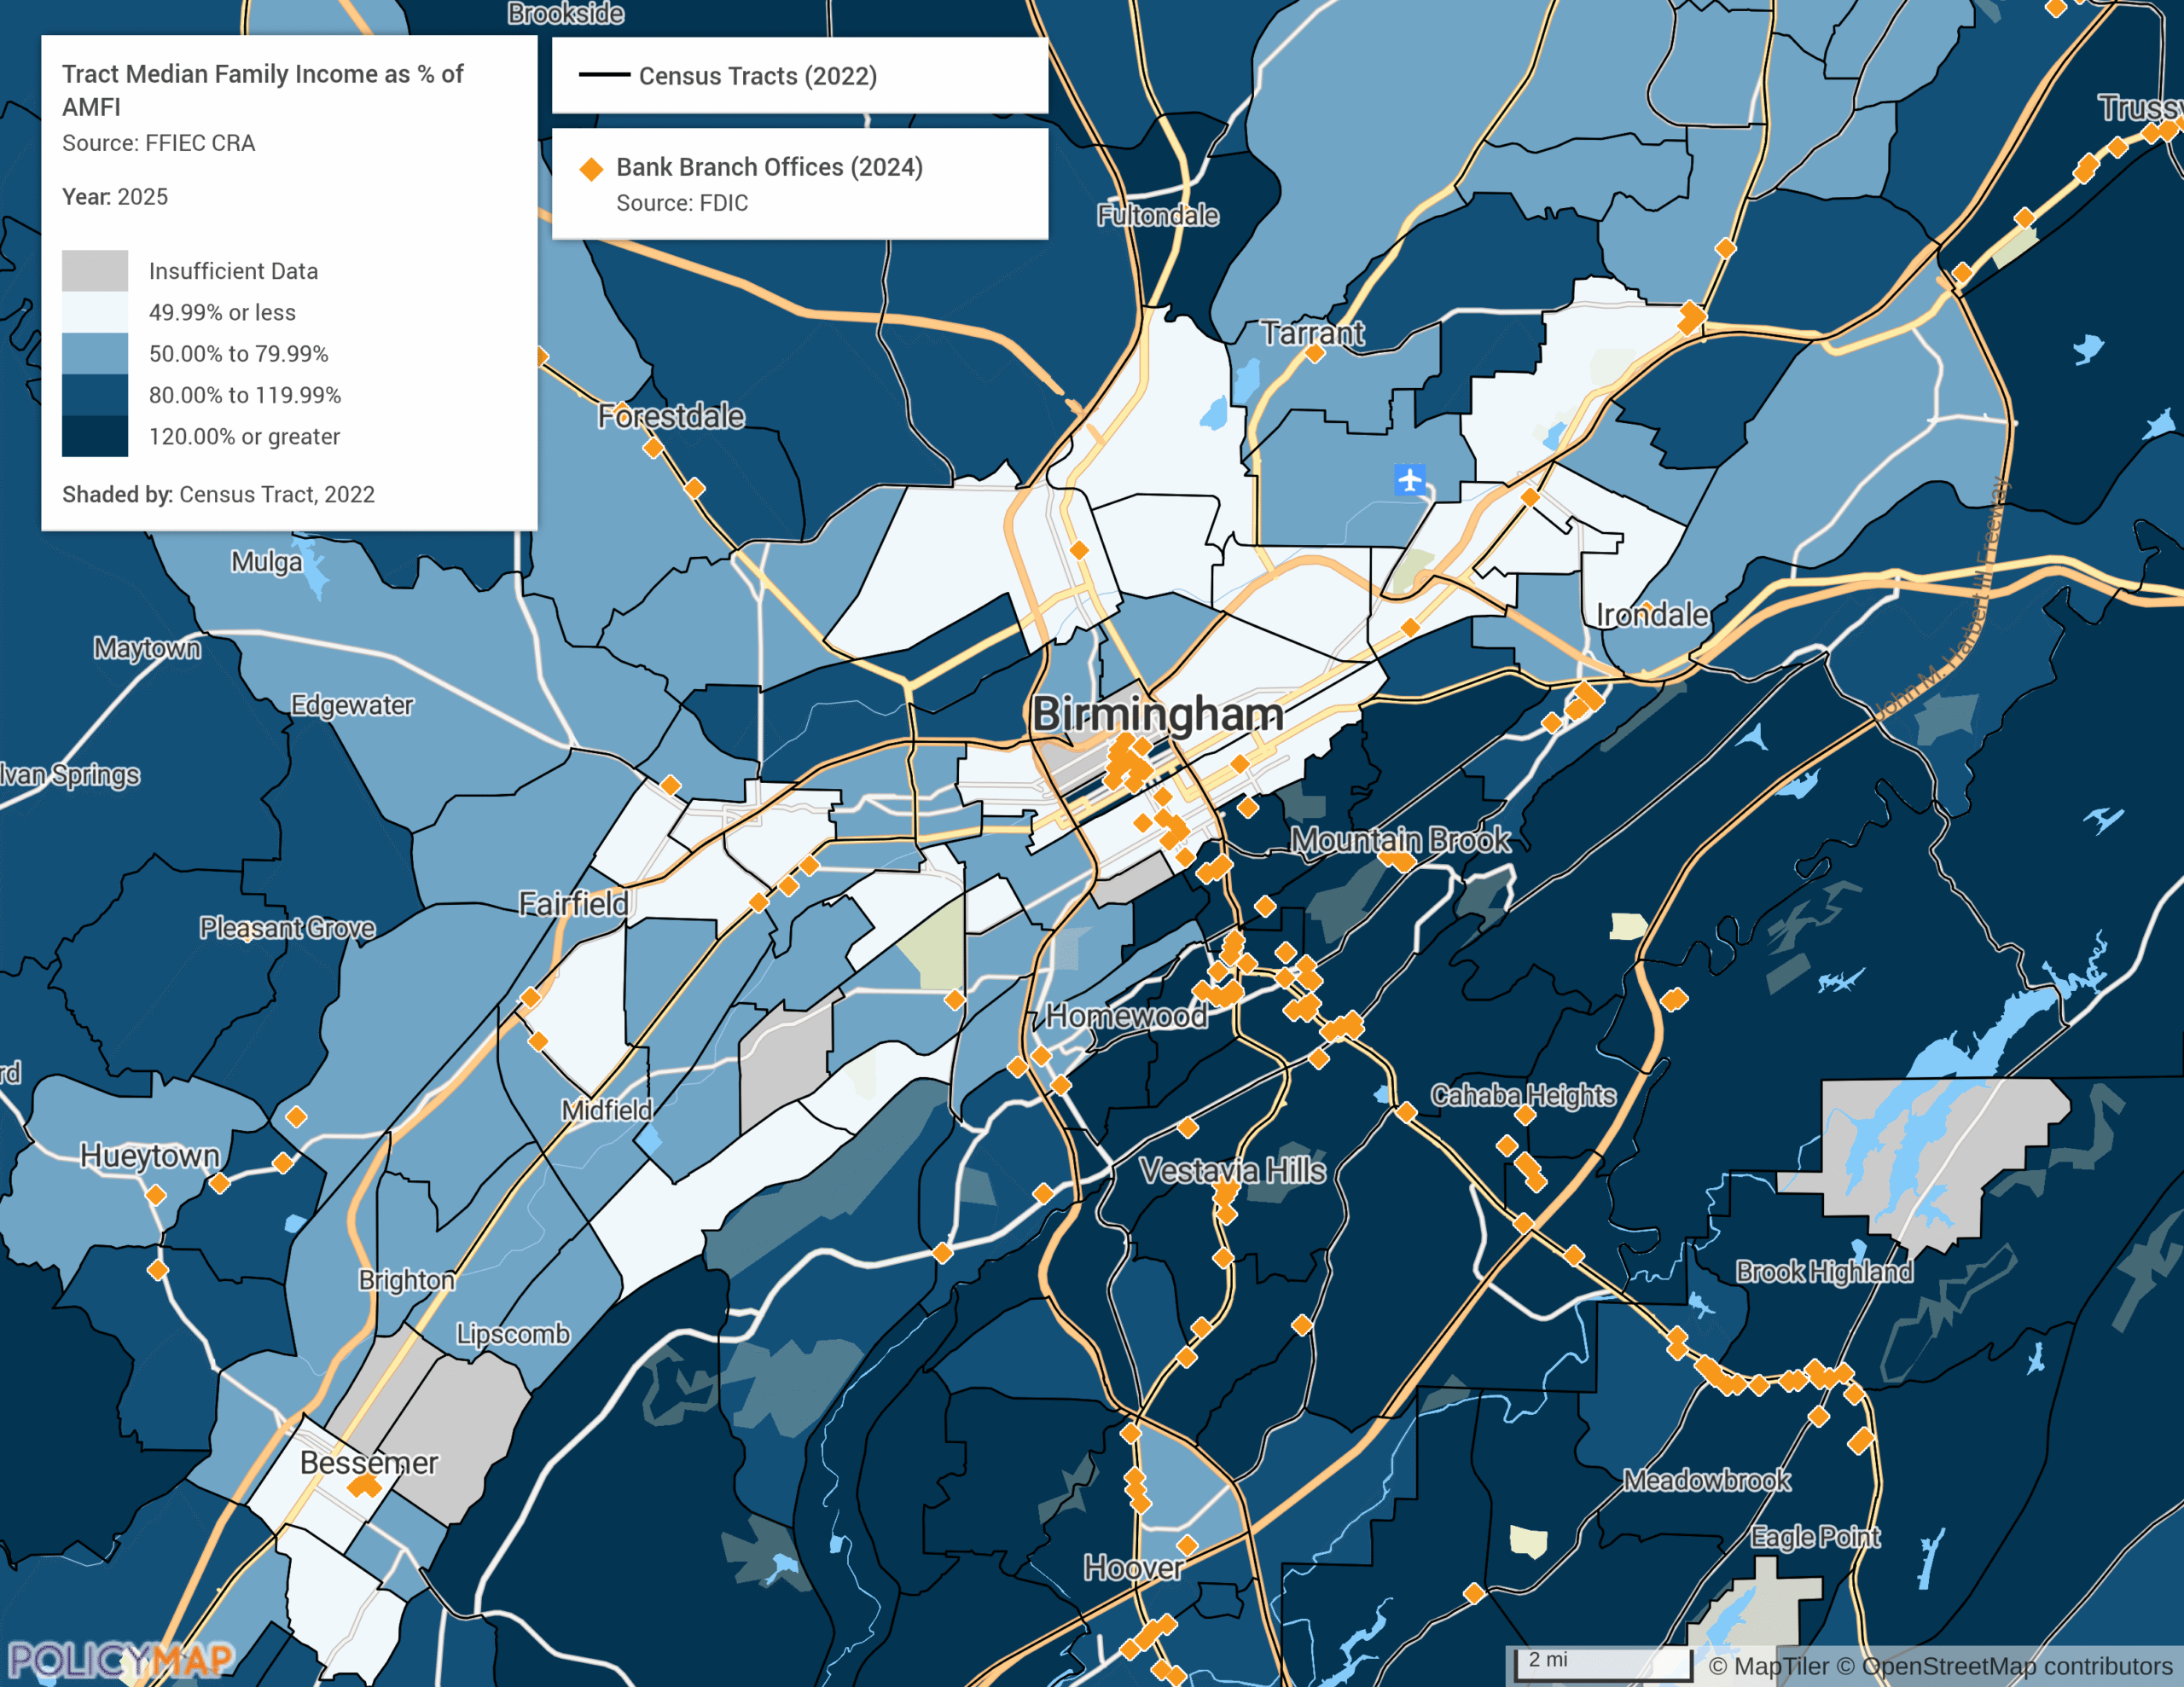
Highlighting Census Tracts with a Poverty Rate of 40% or Higher in Birmingham, AL
CRA underscores the critical need to support communities in census tracts with poverty rates of 40% or higher—areas that often face systemic barriers to economic opportunity.
The high-poverty census tracts located in Birmingham, AL, pictured below, reveal concentrated pockets of need, emphasizing the importance of strategic investments in infrastructure, affordable housing, and small business development.

Powered by data from the U.S. Census Bureau, PolicyMap’s visualization of these tracts provides financial institutions with actionable insights to identify where their community development financing can have the greatest impact. By prioritizing investments in these underserved areas, institutions fulfill CRA impact review factors and contribute to fostering economic stability and resilience in communities that have historically lacked access to essential resources.
Visualizing Low Community Development Investments in Greater Akron, OH
Serving geographic areas with low levels of community development financing is an impactful way to supplement your bank’s CRA activities. Using HUD’s Community Development Block Grant (CDBG) allocations for FY2022, PolicyMap reveals the disparities in funding across Akron, OH, and its surrounding areas.
The map below displays a notable example in the small city of Kent, OH. The city received significantly less funding than neighboring census tracts, as indicated by its lightest shading on the map. PolicyMap equips financial institutions with critical insights to pinpoint areas like Kent, where community development initiatives can make a meaningful difference.

This visualization underscores the importance of identifying and addressing funding gaps in underserved communities. By directing resources to these underfunded regions, funders can ensure a more equitable distribution of support while aligning with CRA.
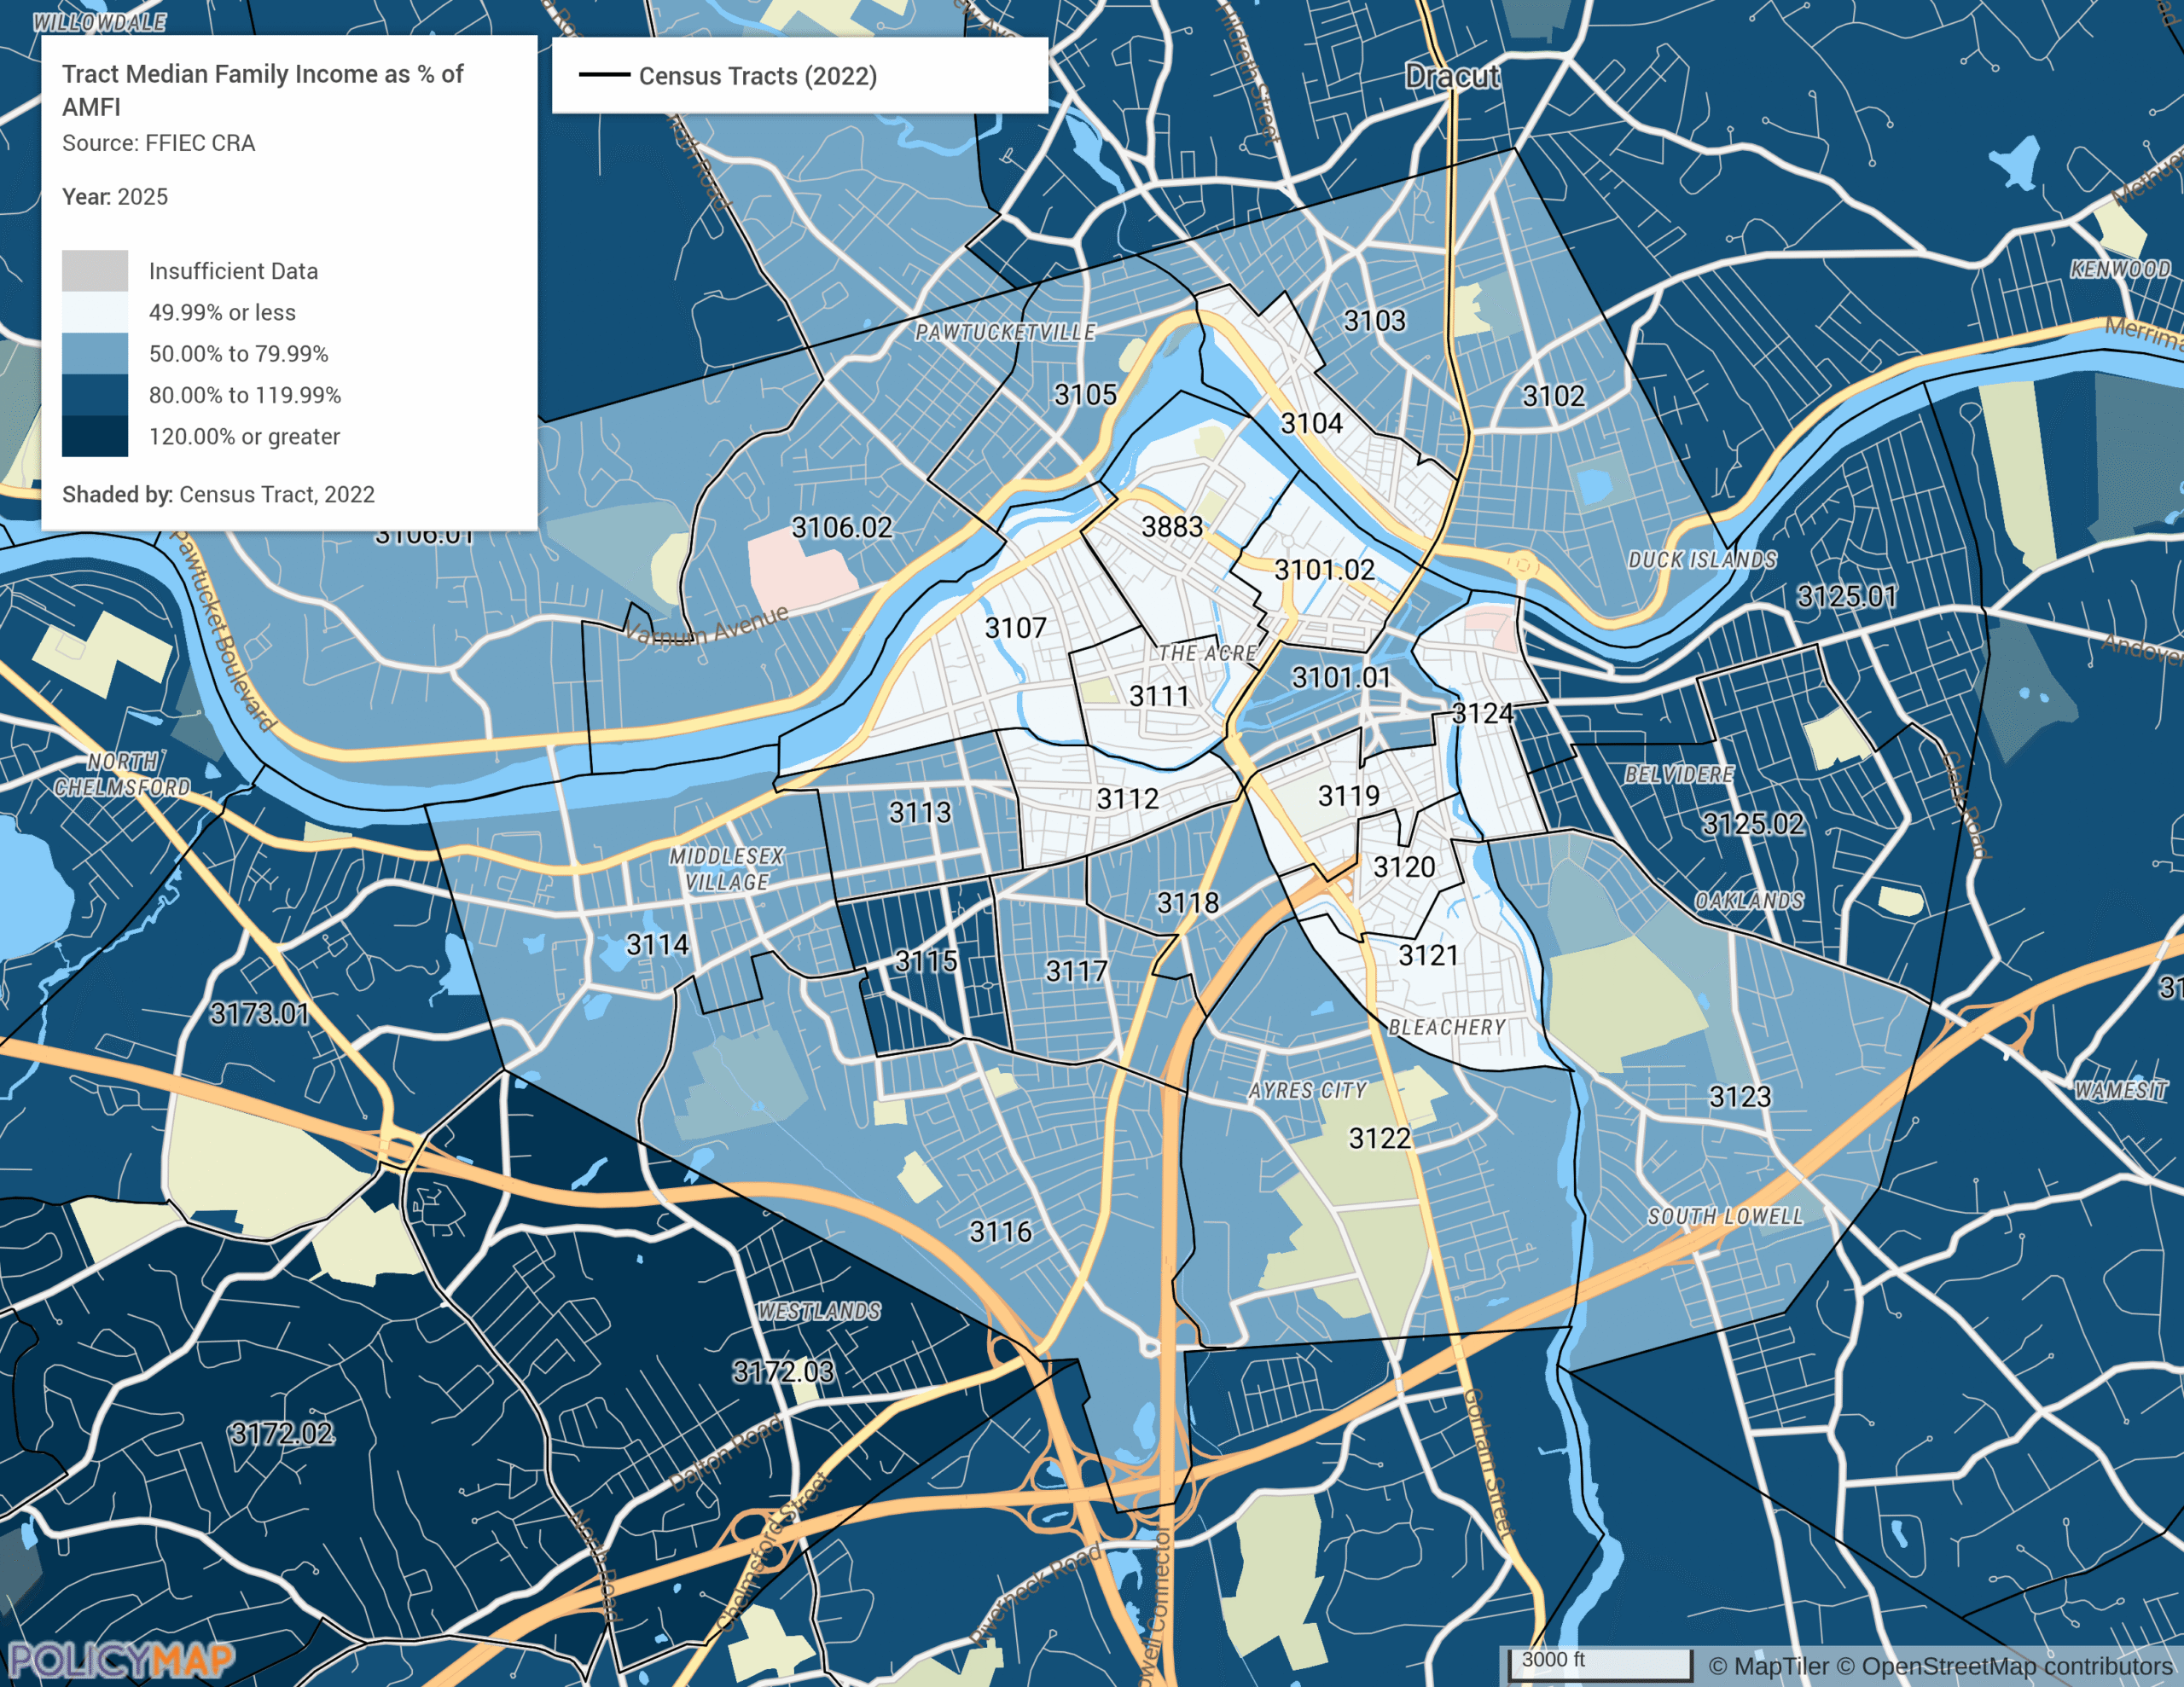
Supporting LMI Families in Lowell, MA
Investing in LMI communities is central to the CRA’s mission, and the need to benefit LMI families and households is a critical factor.
The first map shows the city of Lowell Tract Median Family Income level. Using the same data used by the Federal Financial Institutions Examination Council (FFIEC) for CRA analysis aligns with the data used by the examiners when performing CRA examinations. The tracts highlighted in light blue represent the low- and moderate-income census tracts in the area.
The second map is using data from the ACS and PolicyMap. The map of Lowell, MA highlights census tracts and block groups based on their median household income (MHI) as a share of the area’s MHI between 2018-2022. The lightest blue areas represent very low-income communities with MHIs less than or equal to 30% of the area median, while darker shades indicate progressively higher income levels.
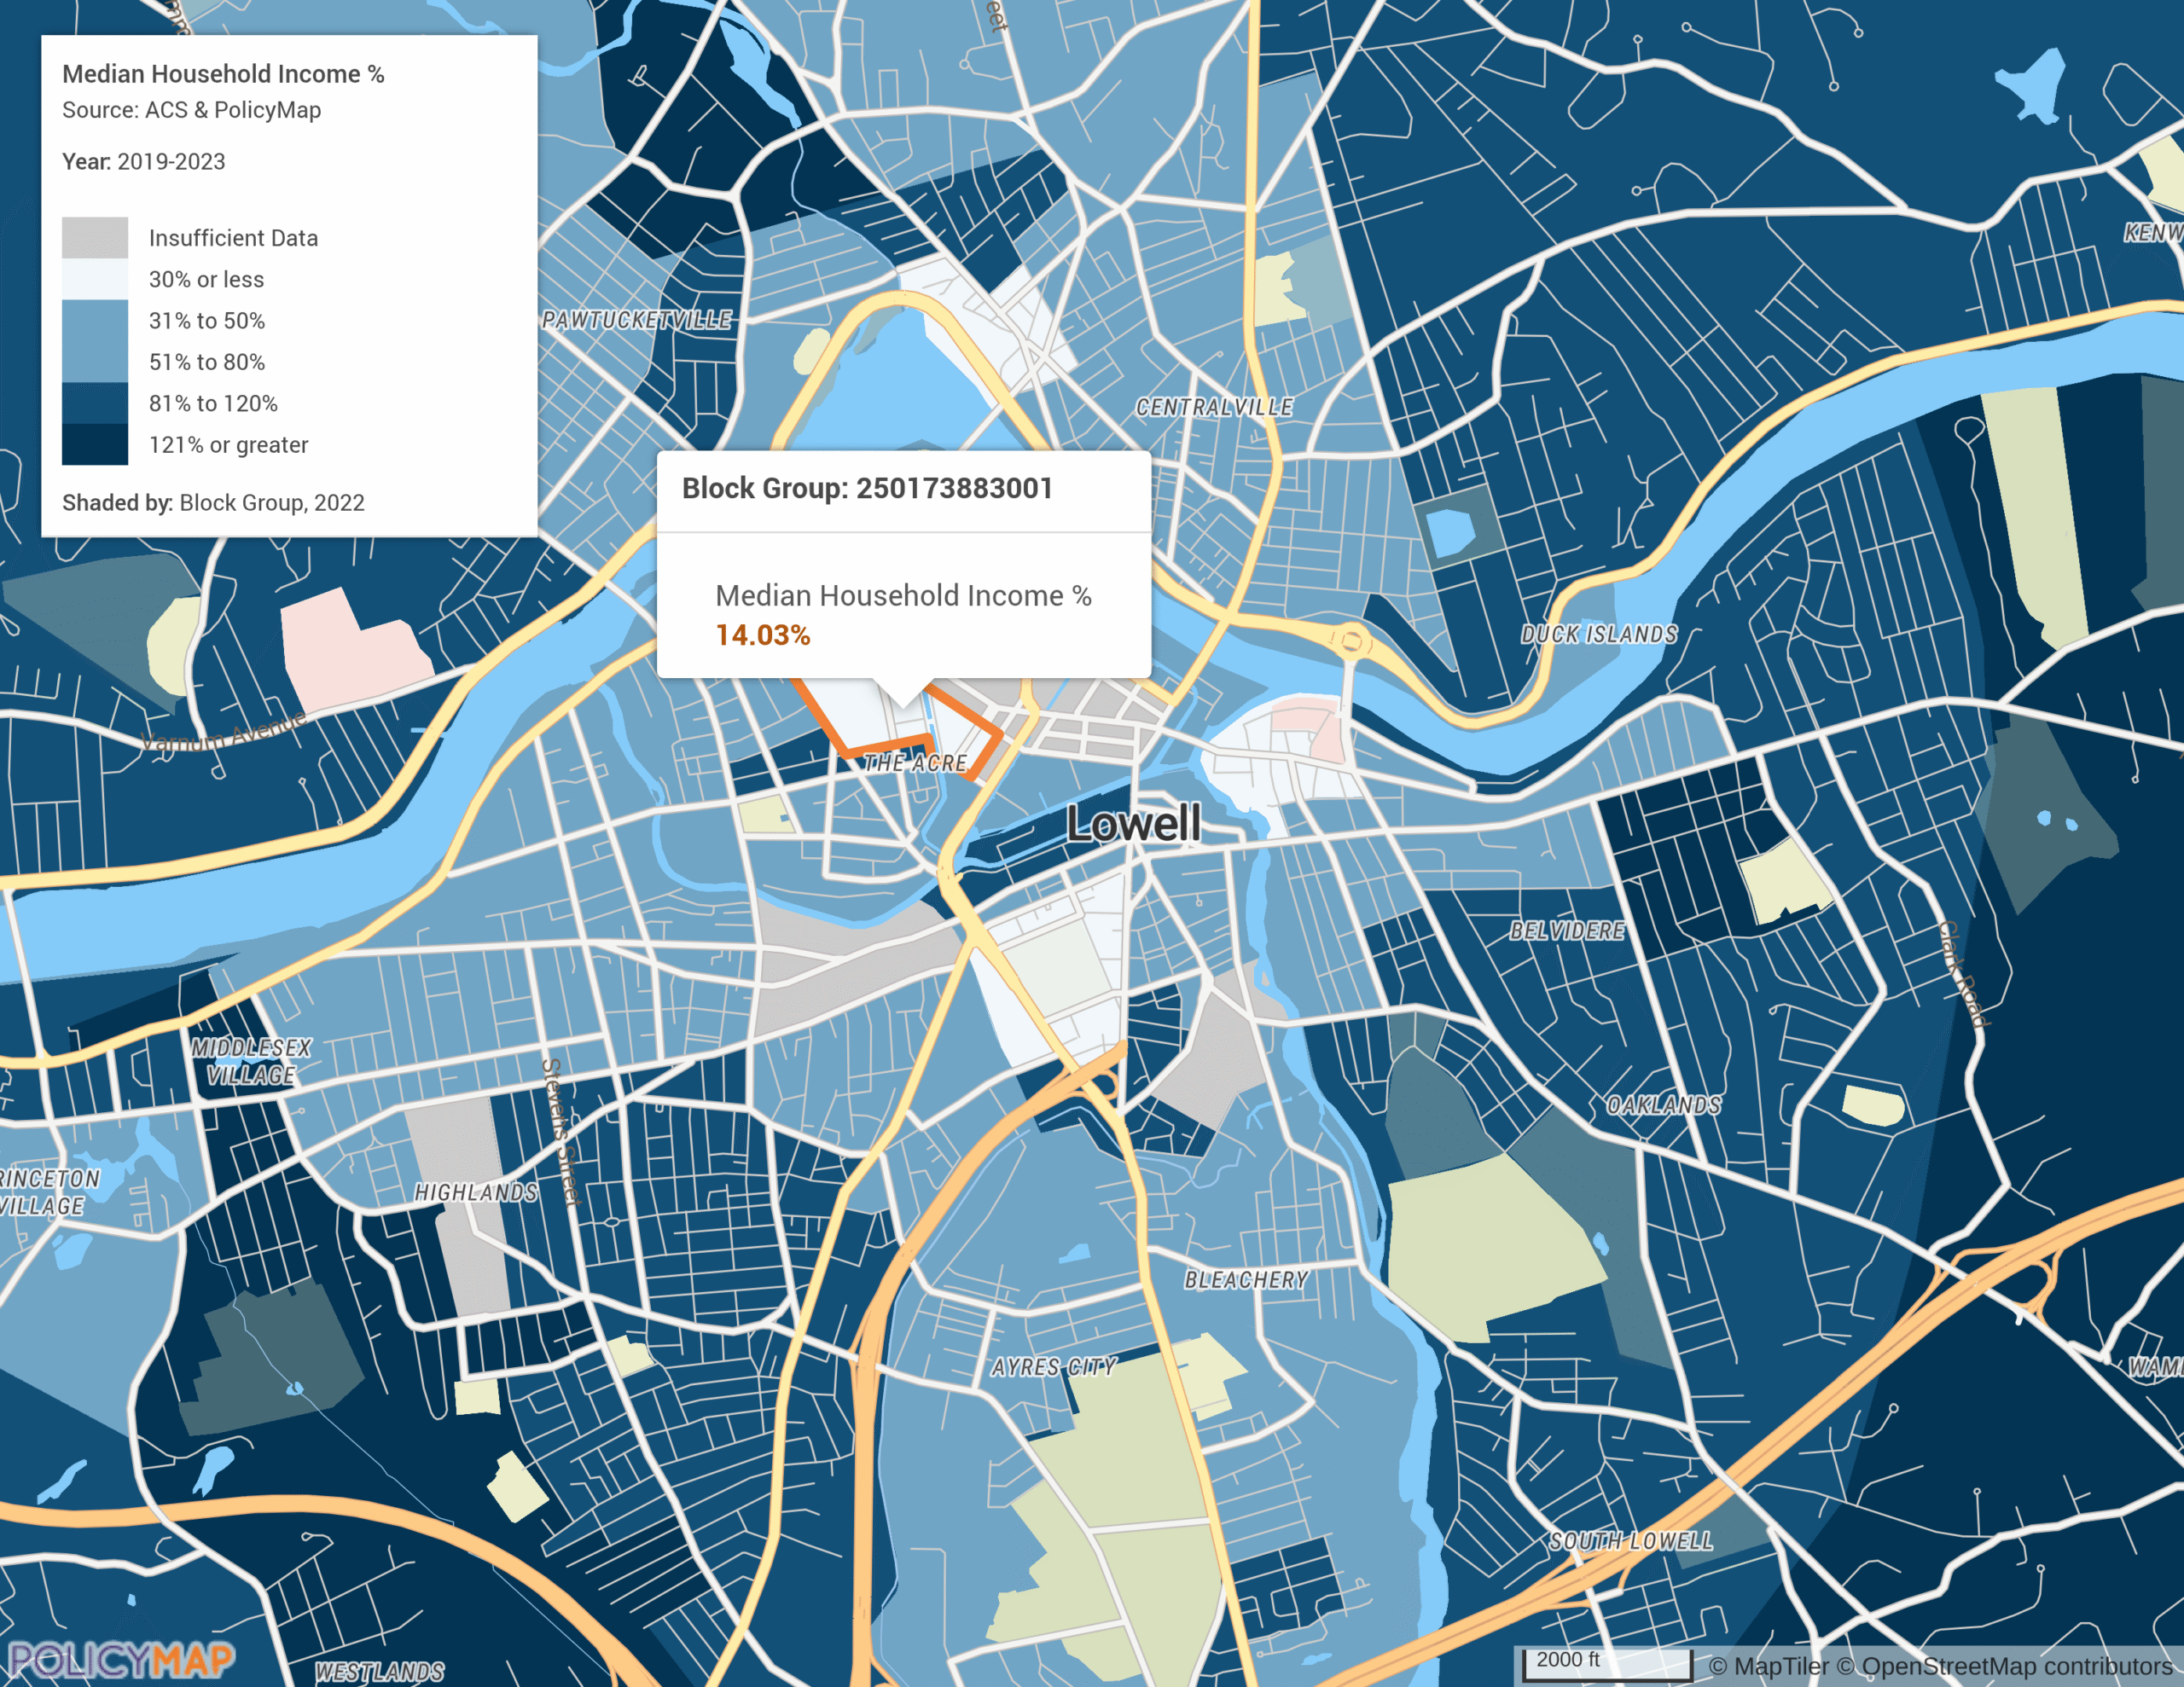
By leveraging PolicyMap’s detailed income data, institutions can better align their initiatives with CRA requirements, foster economic stability, and drive impactful community development for underserved families and households.
By producing these two maps, it showcases the CRA specific data that are aligned with the examiners and generating a performance context to take into consideration recent trends and economic changes and their impact. This drives the impact of activities and allows users to dig deeper into the analysis and further validate their CRA activities and opportunities.
Supporting Small Businesses in Queens, NY
Small businesses are the backbone of local economies, providing jobs and fostering economic resilience in communities. Supporting small businesses with revenues of $1 million or less is a key factor in CRA eligibility, making it essential to identify areas where these businesses thrive. Going for a deeper dive to promote small businesses and increase access to jobs that produce a living wage helps build the performance context of the needs of the community. The map below uses data from the Longitudinal Employer-Household Dynamics (LEHD) to highlight census tracts in Queens, NY with the highest concentration of jobs at firms with fewer than 20 employees as of 2021.

This geospatial analysis can help financial institutions and policymakers pinpoint areas with significant small business activity, uncovering opportunities to provide tailored financial products, loans, and support services.
Promoting Affordable Housing in High Opportunity Areas: Roseville, CA
Affordable housing in High Opportunity Areas is vital for fostering equitable access to resources like quality education, healthcare, and employment. While the current CRA does not specifically mention High Opportunity Areas, activities in these areas that directly facilitate the development or preservation of affordable housing in these tracts are vital to those communities and can be a focus in your community development plan and performance context.

PolicyMap’s visualization of High Opportunity Areas of Roseville and Greater Placer County, shown in the map above, enables financial institutions to pinpoint Difficult Development Areas (DDA) tracts and identify opportunities for impactful housing investments. Harnessing this data enables stakeholders to align their initiatives with regulatory factors, ensuring that resources are directed toward expanding affordable housing in areas that offer significant opportunities for residents to thrive.
Supporting Native Land Areas: Navajo Reservation, AZ
The CRA’s Q&A recognizes the importance of promoting economic development on Indian reservations and all modernization efforts have also acknowledged the unique challenges faced by Indigenous communities. The agencies have included Native Land Areas as factors in determining if an activity qualifies for CRA credit in all the proposed changes to modernize CRA. U.S. Census Bureau demographic data from 2018-2022, visualized in the map below, highlights portions of the Navajo Nation, home to significant populations of Indigenous residents.

This geospatial analysis allows financial institutions to identify and prioritize investments in these areas. Contributors can better address the critical need for community development initiatives—such as infrastructure, housing, and economic development—while fostering equitable opportunities for Native populations.
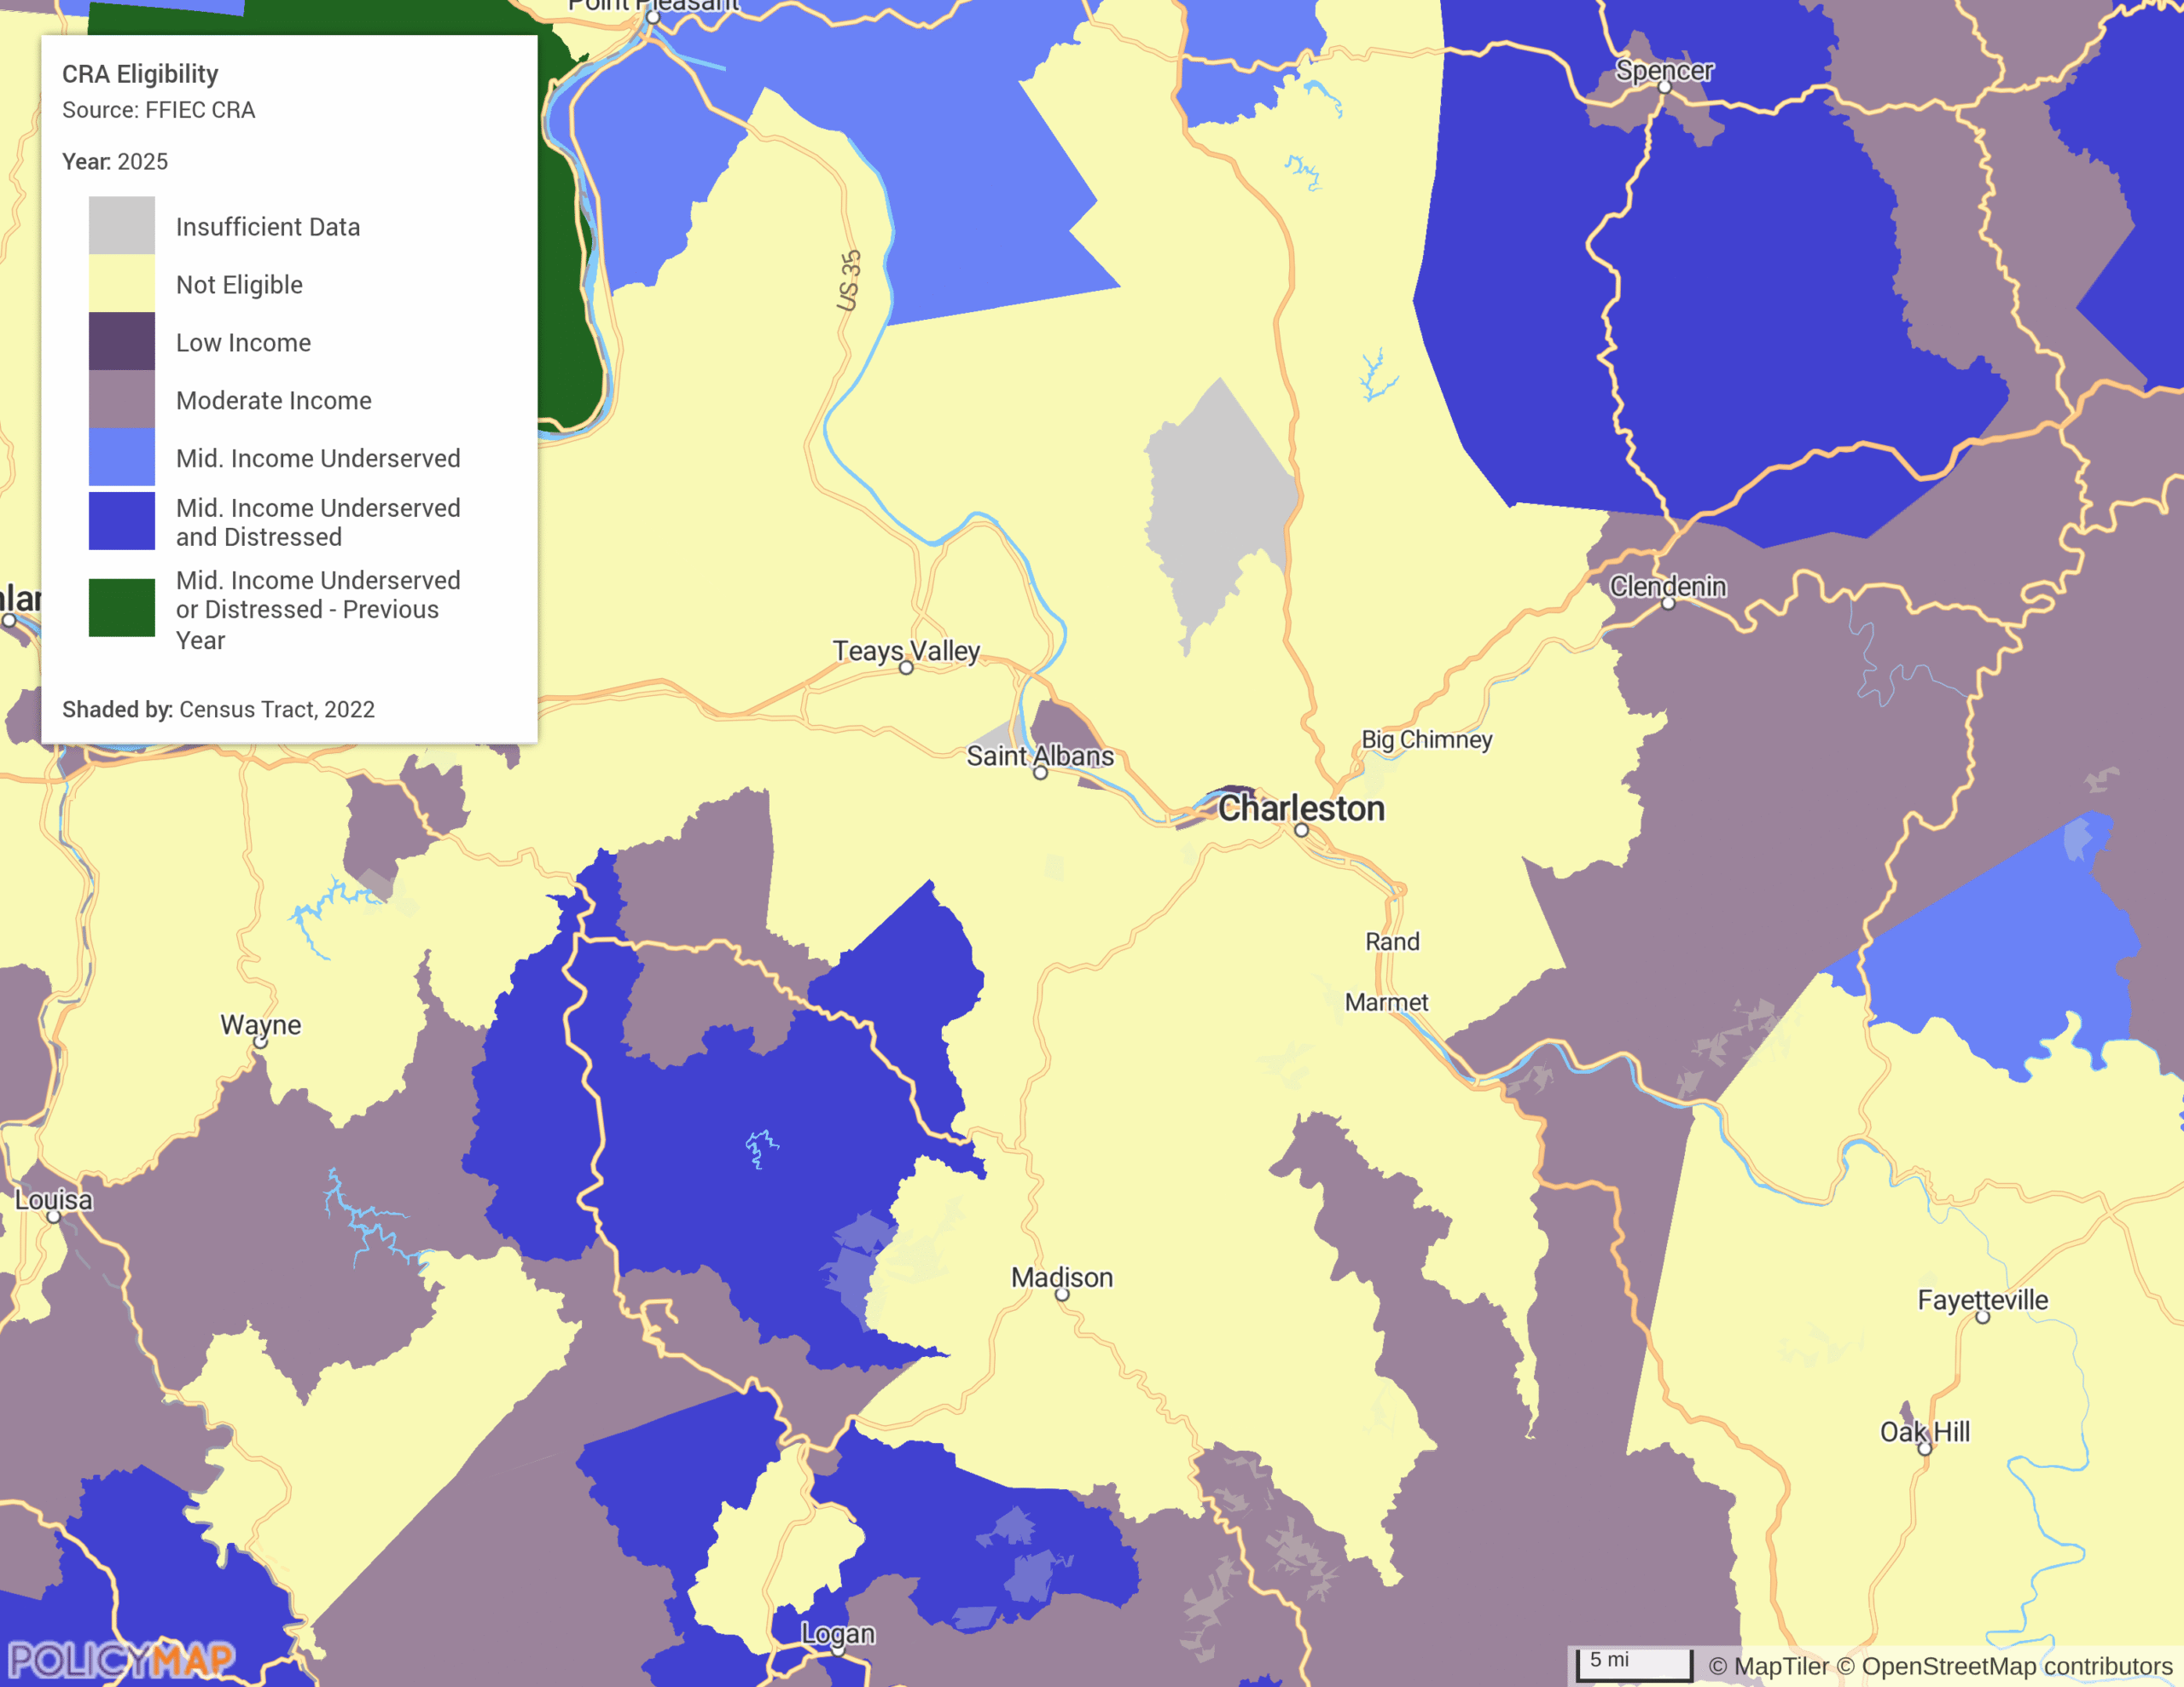
New Markets Tax Credits Eligibility in Appalachia
The FFIEC publishes a list of census tracts that are Distressed or underserved nonmetropolitan middle-income geographies designated by the Federal Reserve System. Activities that revitalize or stabilize these communities will qualify as CRA credit. In addition, the Appalachian Regional Commission (ARC) designates certain counties and tracts in Appalachia as “distressed areas” based on economic indicators such as unemployment rates, per capita market incomes, and poverty rates, and compares these metrics to national averages. This data is essential for assessing investments in projects financed by low-income housing tax credits (LIHTCs) or New Markets Tax Credits (NMTCs) as part of regulatory impact review factors.

The map above visualizes 2025 data from ARC, highlighting the most distressed areas of Greater Charleston and the Appalachian Region in West Virginia. Access to this data through PolicyMap enables the identification of high-need regions, ensuring that investments are directed toward areas requiring economic revitalization. This approach helps meet CRA requirements and promotes equitable growth and community development.
The map below visualizes CRA eligibility as of 2025 using FFIEC Distressed and Underserved Middle-Income Geographies and low-income and moderate-income census tracts to highlight the areas qualifying for CRA credit for investments, services, and loans that revitalize or stabilize the communities in which they are made.
Identifying High-Need Areas for Community Development in Milwaukee, WI
In Milwaukee, WI, the layered map below visually emphasizes areas most in need of community development financing products and services, particularly for LMI households. The first layer displays Census tracts that qualify as a CDFI Program Investment Area as of 2023, using data from the 2016-2020 American Community Survey. These areas are designated by the CDFI Fund, indicating a higher need for focused investments. The map’s shading reveals tracts that meet these criteria, which can include both qualifying and non-qualifying areas, provided the non-qualifying tracts represent no more than 15% of the total Investment Area population. This data is pivotal in identifying regions where new financing products or services can have the greatest impact on low- and moderate-income individuals, families, or households.
The second layer enhances this analysis by incorporating Local Median Family Income (MFI) as a share of Area Median Family Income (AMFI) from 2018-2022. The map categorizes tracts based on income levels, ranging from very low-income tracts to upper-income areas. The purple highlighted tracts, qualifying in both datasets, represent the highest need areas in Milwaukee, where both income levels and CDFI program eligibility align.

By overlaying these two datasets, PolicyMap facilitates a nuanced understanding of where community development investments can most effectively address economic challenges. This layered approach ensures investments are strategically directed, fostering inclusive growth in Milwaukee’s underserved neighborhoods.
Why PolicyMap?
In 2007, PolicyMap began as a small division of Reinvestment Fund, a Philadelphia-based Community Development Financial Institution (CDFI). While Reinvestment Fund uses capital to drive impact, PolicyMap uses data. Today, PolicyMap’s advanced mapping and data visualization tools are an indispensable resource for community development and financial stakeholders working with Community Reinvestment Act incentives and funding.
By providing intuitive, easy-to-navigate mapping capabilities, combined with comprehensive demographic, economic, and lending data, PolicyMap enables users to precisely identify and analyze LMI areas that may be eligible for CRA funding. This capability ensures that financial institutions can effectively qualify their CRA loans, investments, and service activities to enhance compliance with regulations using the same source of data and census tract boundaries as the regulators performing the CRA examinations.
Request More Information
With PolicyMap, institutions gain a powerful tool to make data-driven decisions that align with CRA goals – empowering them to drive meaningful development and promote financial inclusion in the communities they serve.