
Mapping Relief: The Library’s Role in Disasters

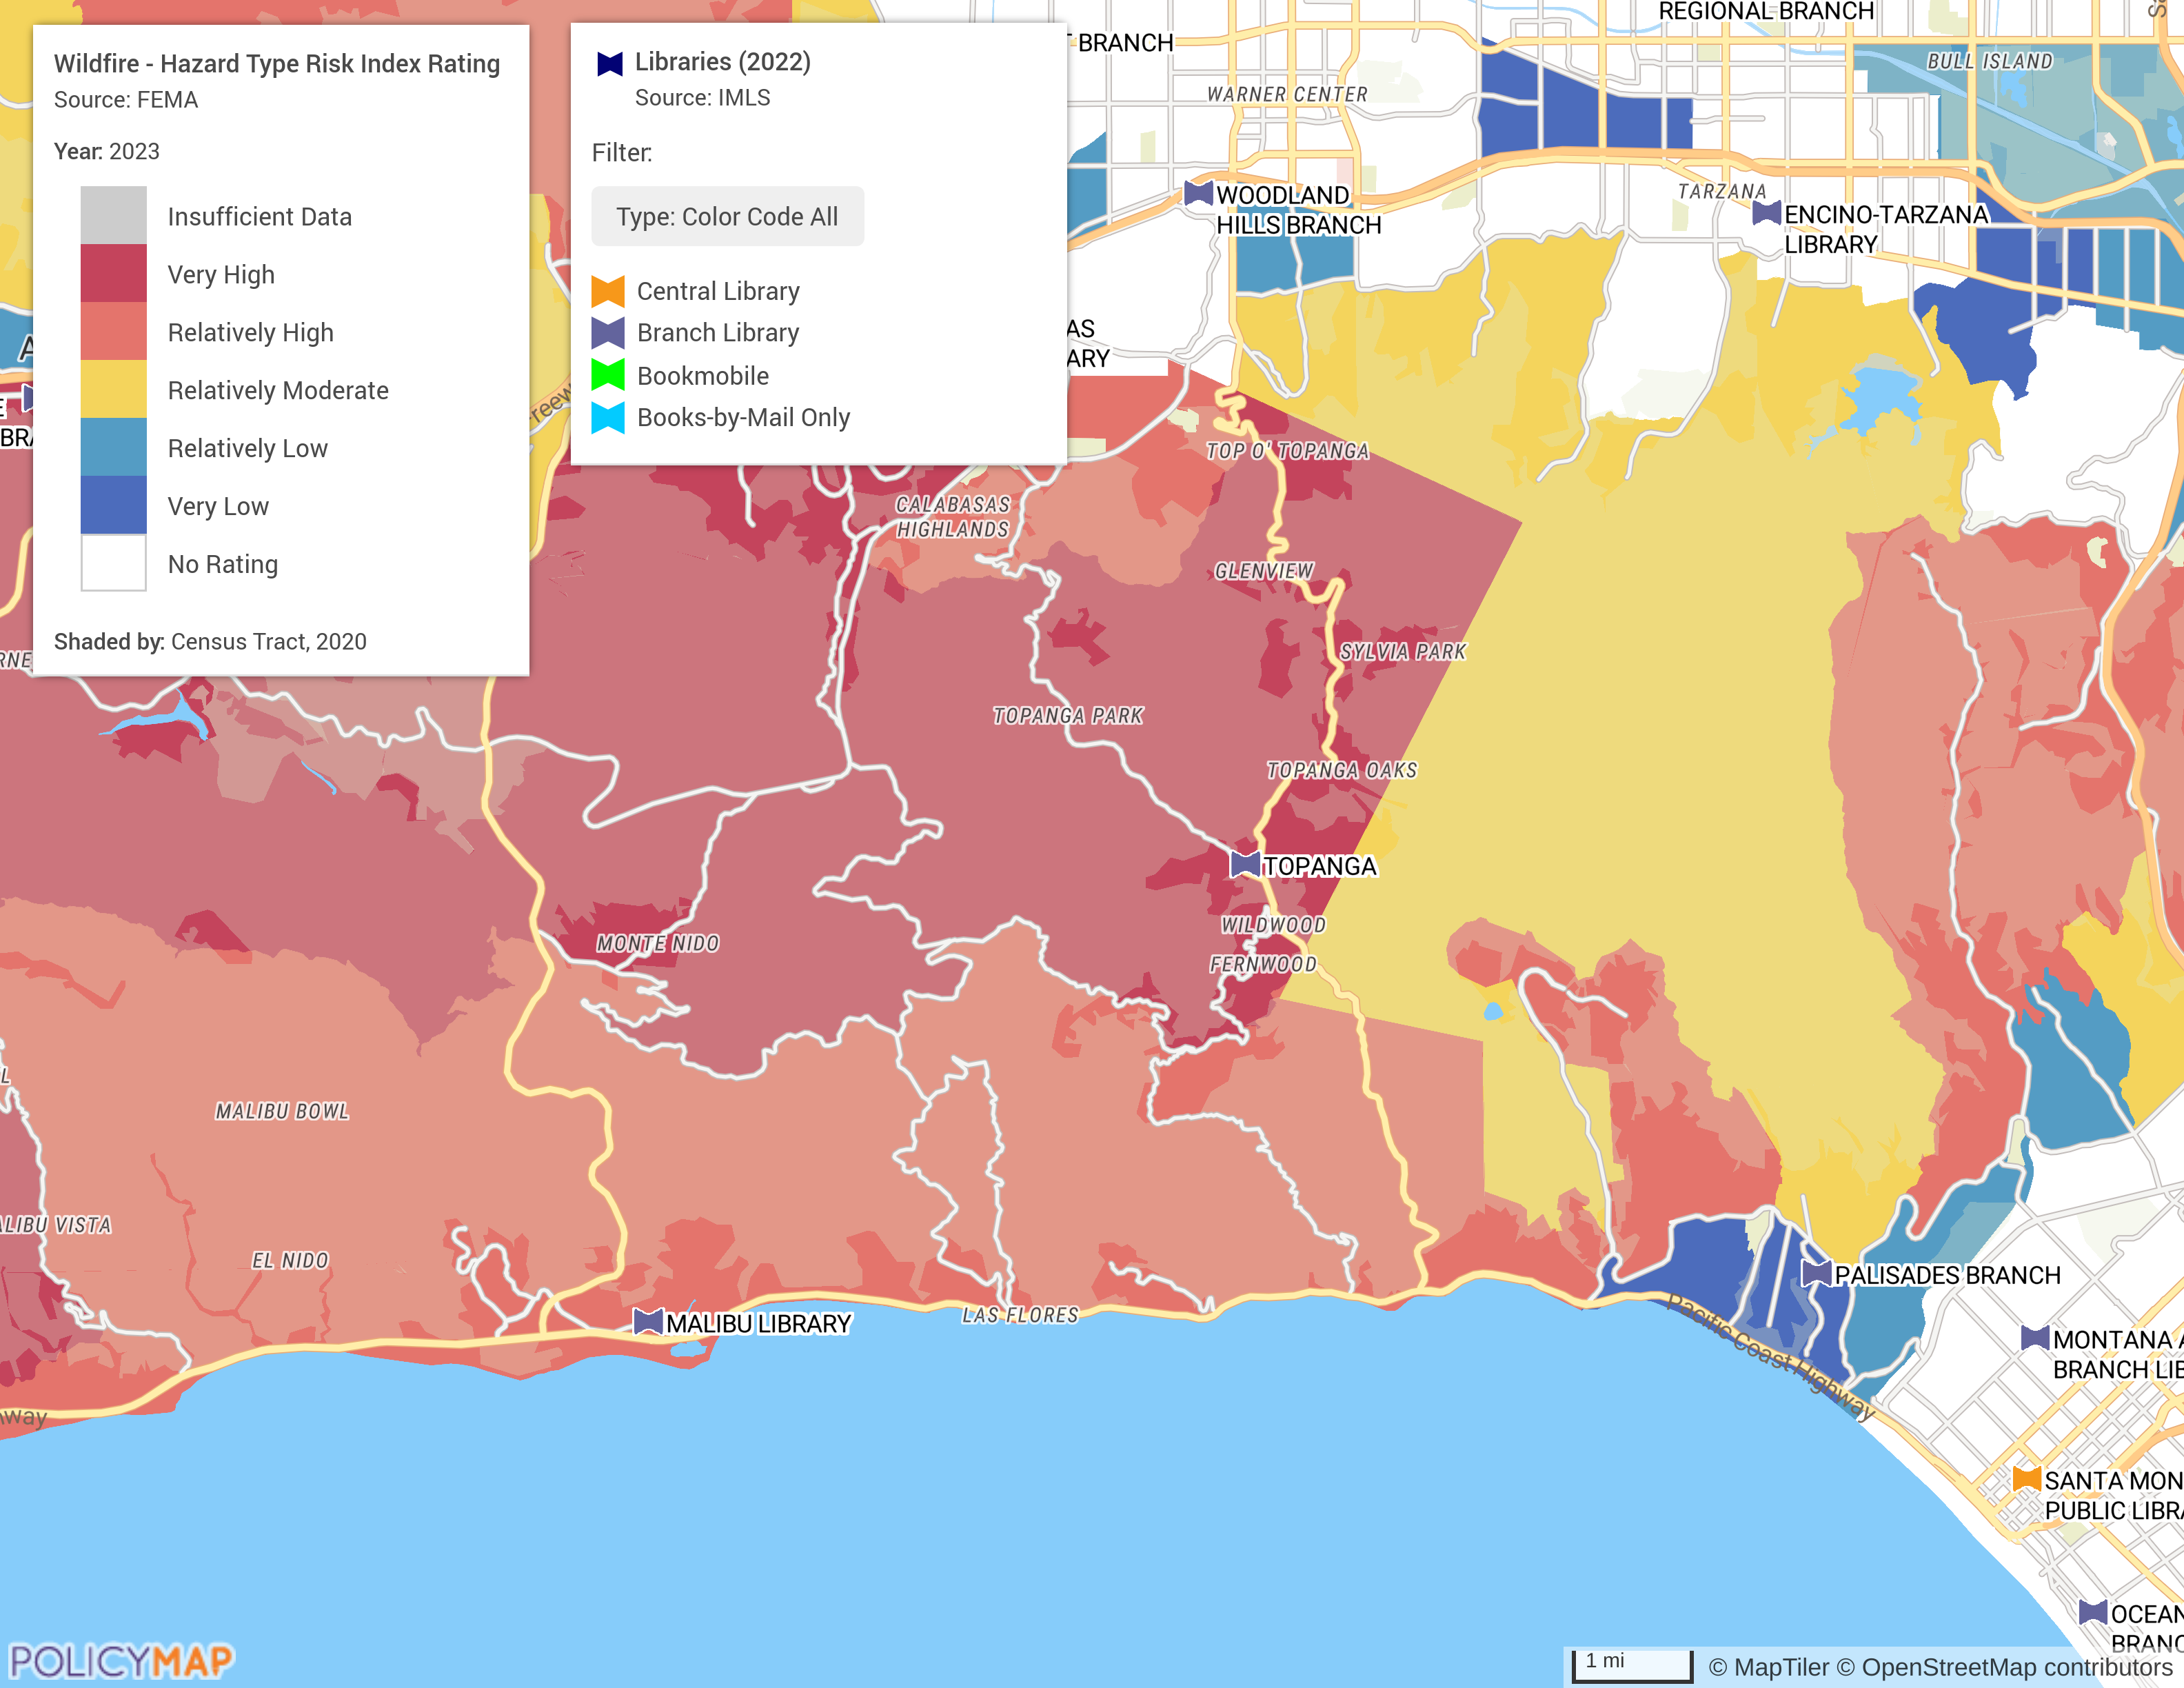
When disaster strikes, public libraries often transform from places of learning into vital lifelines. During the Los Angeles wildfires, the Topanga Library acted as a shelter and supply station, while seven other L.A. branches provided FEMA assistance services.
Following Hurricane Michael in Florida, Bay County librarians established a volunteer reception center to assist residents facing immediate recovery challenges. In Brazoria County, Texas, collaborative county library systems enabled librarians to engage in emergency planning, guaranteeing their involvement in discussions before the next storm arrives. As the Institute of Museum and Library Services (IMLS) put it: “Librarians are unsung heroes for small, rural communities in times of disaster.”— IMLS Blog, 2022
Research from the University of Texas at Austin’s Technology and Information Policy Institute (TIPI) confirms that libraries play a crucial role in disaster response, particularly in rural areas. They provide access to information, internet connectivity, notary services, and vital links to local aid organizations. TIPI found that a library’s effectiveness is closely related to how well it integrates into community emergency planning systems.
Mapping Vulnerability and Access
No two households are affected by disasters in the same way. Individuals living in poverty, experiencing chronic illness, struggling with housing affordability or quality issues, or facing language and transportation barriers often bear the brunt and take longer to recover. Veterans, people with disabilities, older adults, and children often face overlapping risks.
Maps and data enable community leaders to see existing vulnerabilities and current support systems. By creating maps with as many as five data layers, librarians, planners, and emergency managers can enhance their preparation efforts.
Combining American Community Survey (ACS) data with other vital datasets enhances our understanding of neighborhood vulnerabilities. This highlights crucial factors influencing disaster impacts on communities. Analyzing these datasets reveals issues related to health, infrastructure, environment, and access to services, enabling equitable planning and recovery efforts.
Key data sources include:
CDC PLACES: Provides localized estimates of chronic health conditions, disability rates, and preventive health behaviors at the census tract level—crucial for understanding medical vulnerability during and after a disaster.

Environmental Justice Index (EJI): This index measures cumulative environmental burdens and population health impacts in the context of social vulnerability, highlighting communities disproportionately affected by pollution and environmental hazards. EJScreen was the EPA’s tool for identifying environmental justice concerns by combining environmental and demographic data into EJ and Supplemental Indexes. These indices used factors like pollution levels, income, race, disability, education, and life expectancy to highlight vulnerable communities, with data shown as percentiles at the state or national level.
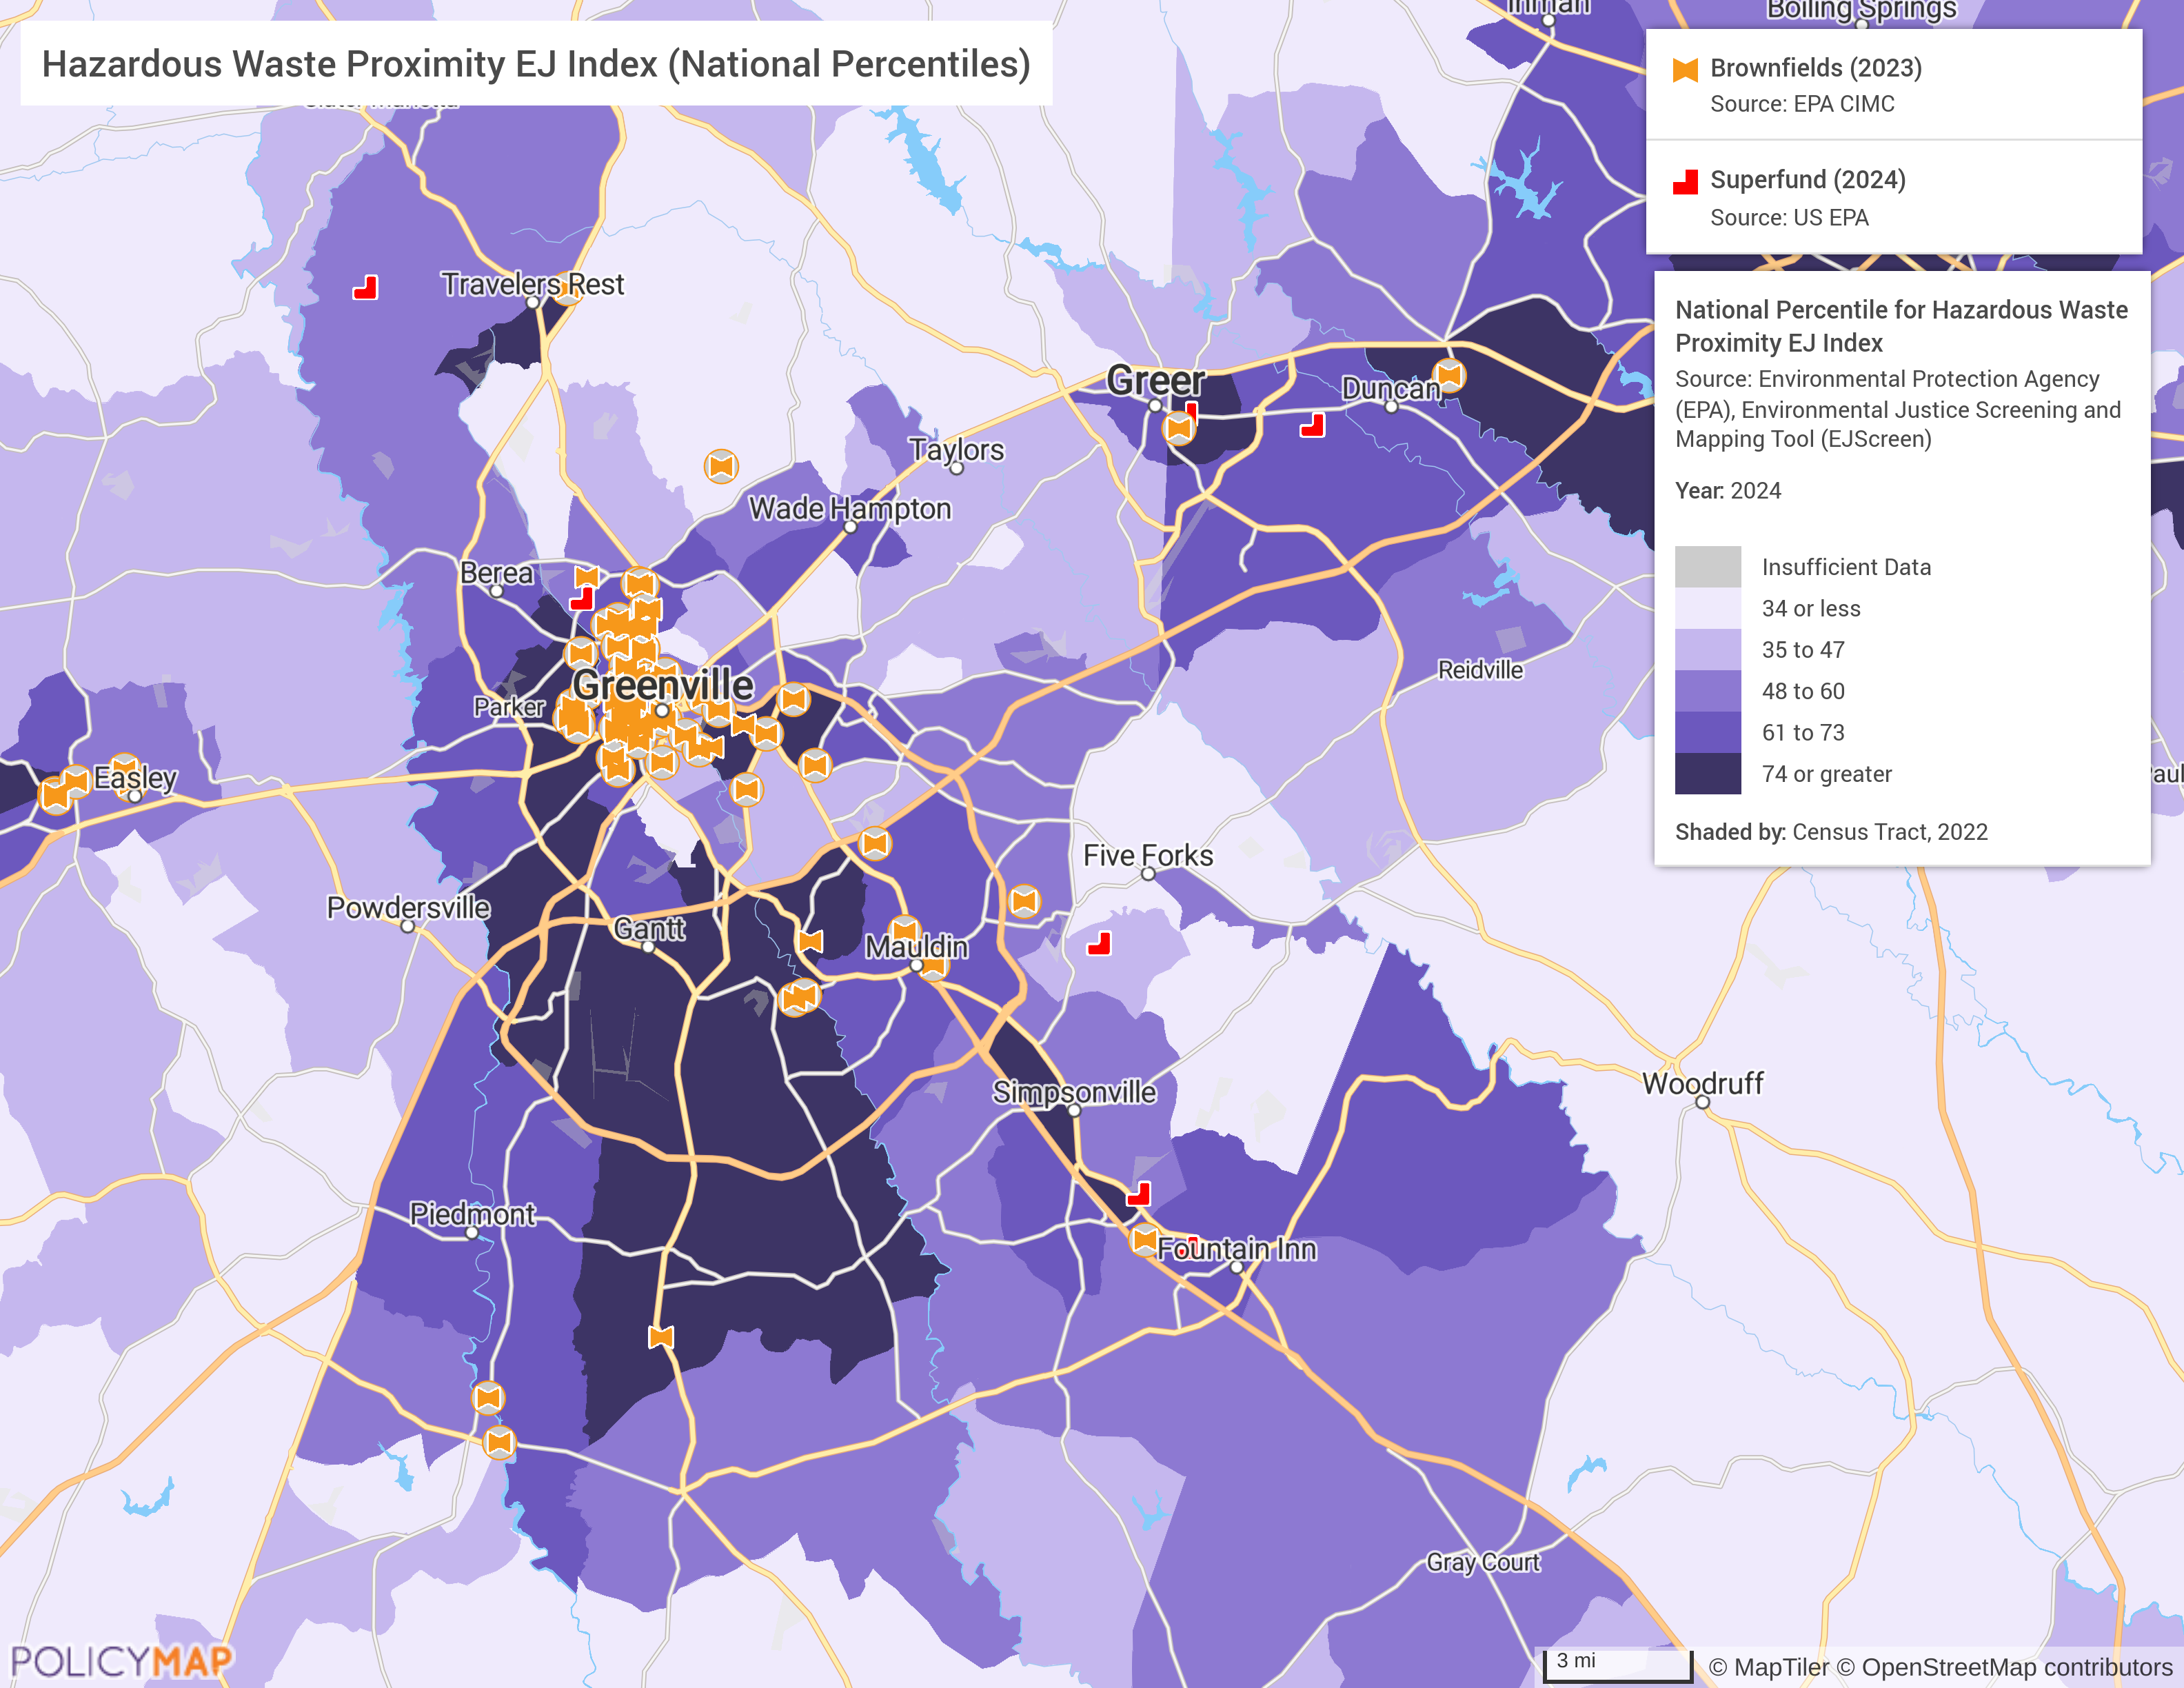
While EJScreen data has been removed from the EPA’s website, it is still available on PolicyMap for continued use in research, planning, and community work.
Social Vulnerability Index (SVI): This index integrates social, economic, health, environmental, and climate risk indicators to assess which communities need the most support before, during, and after emergencies.

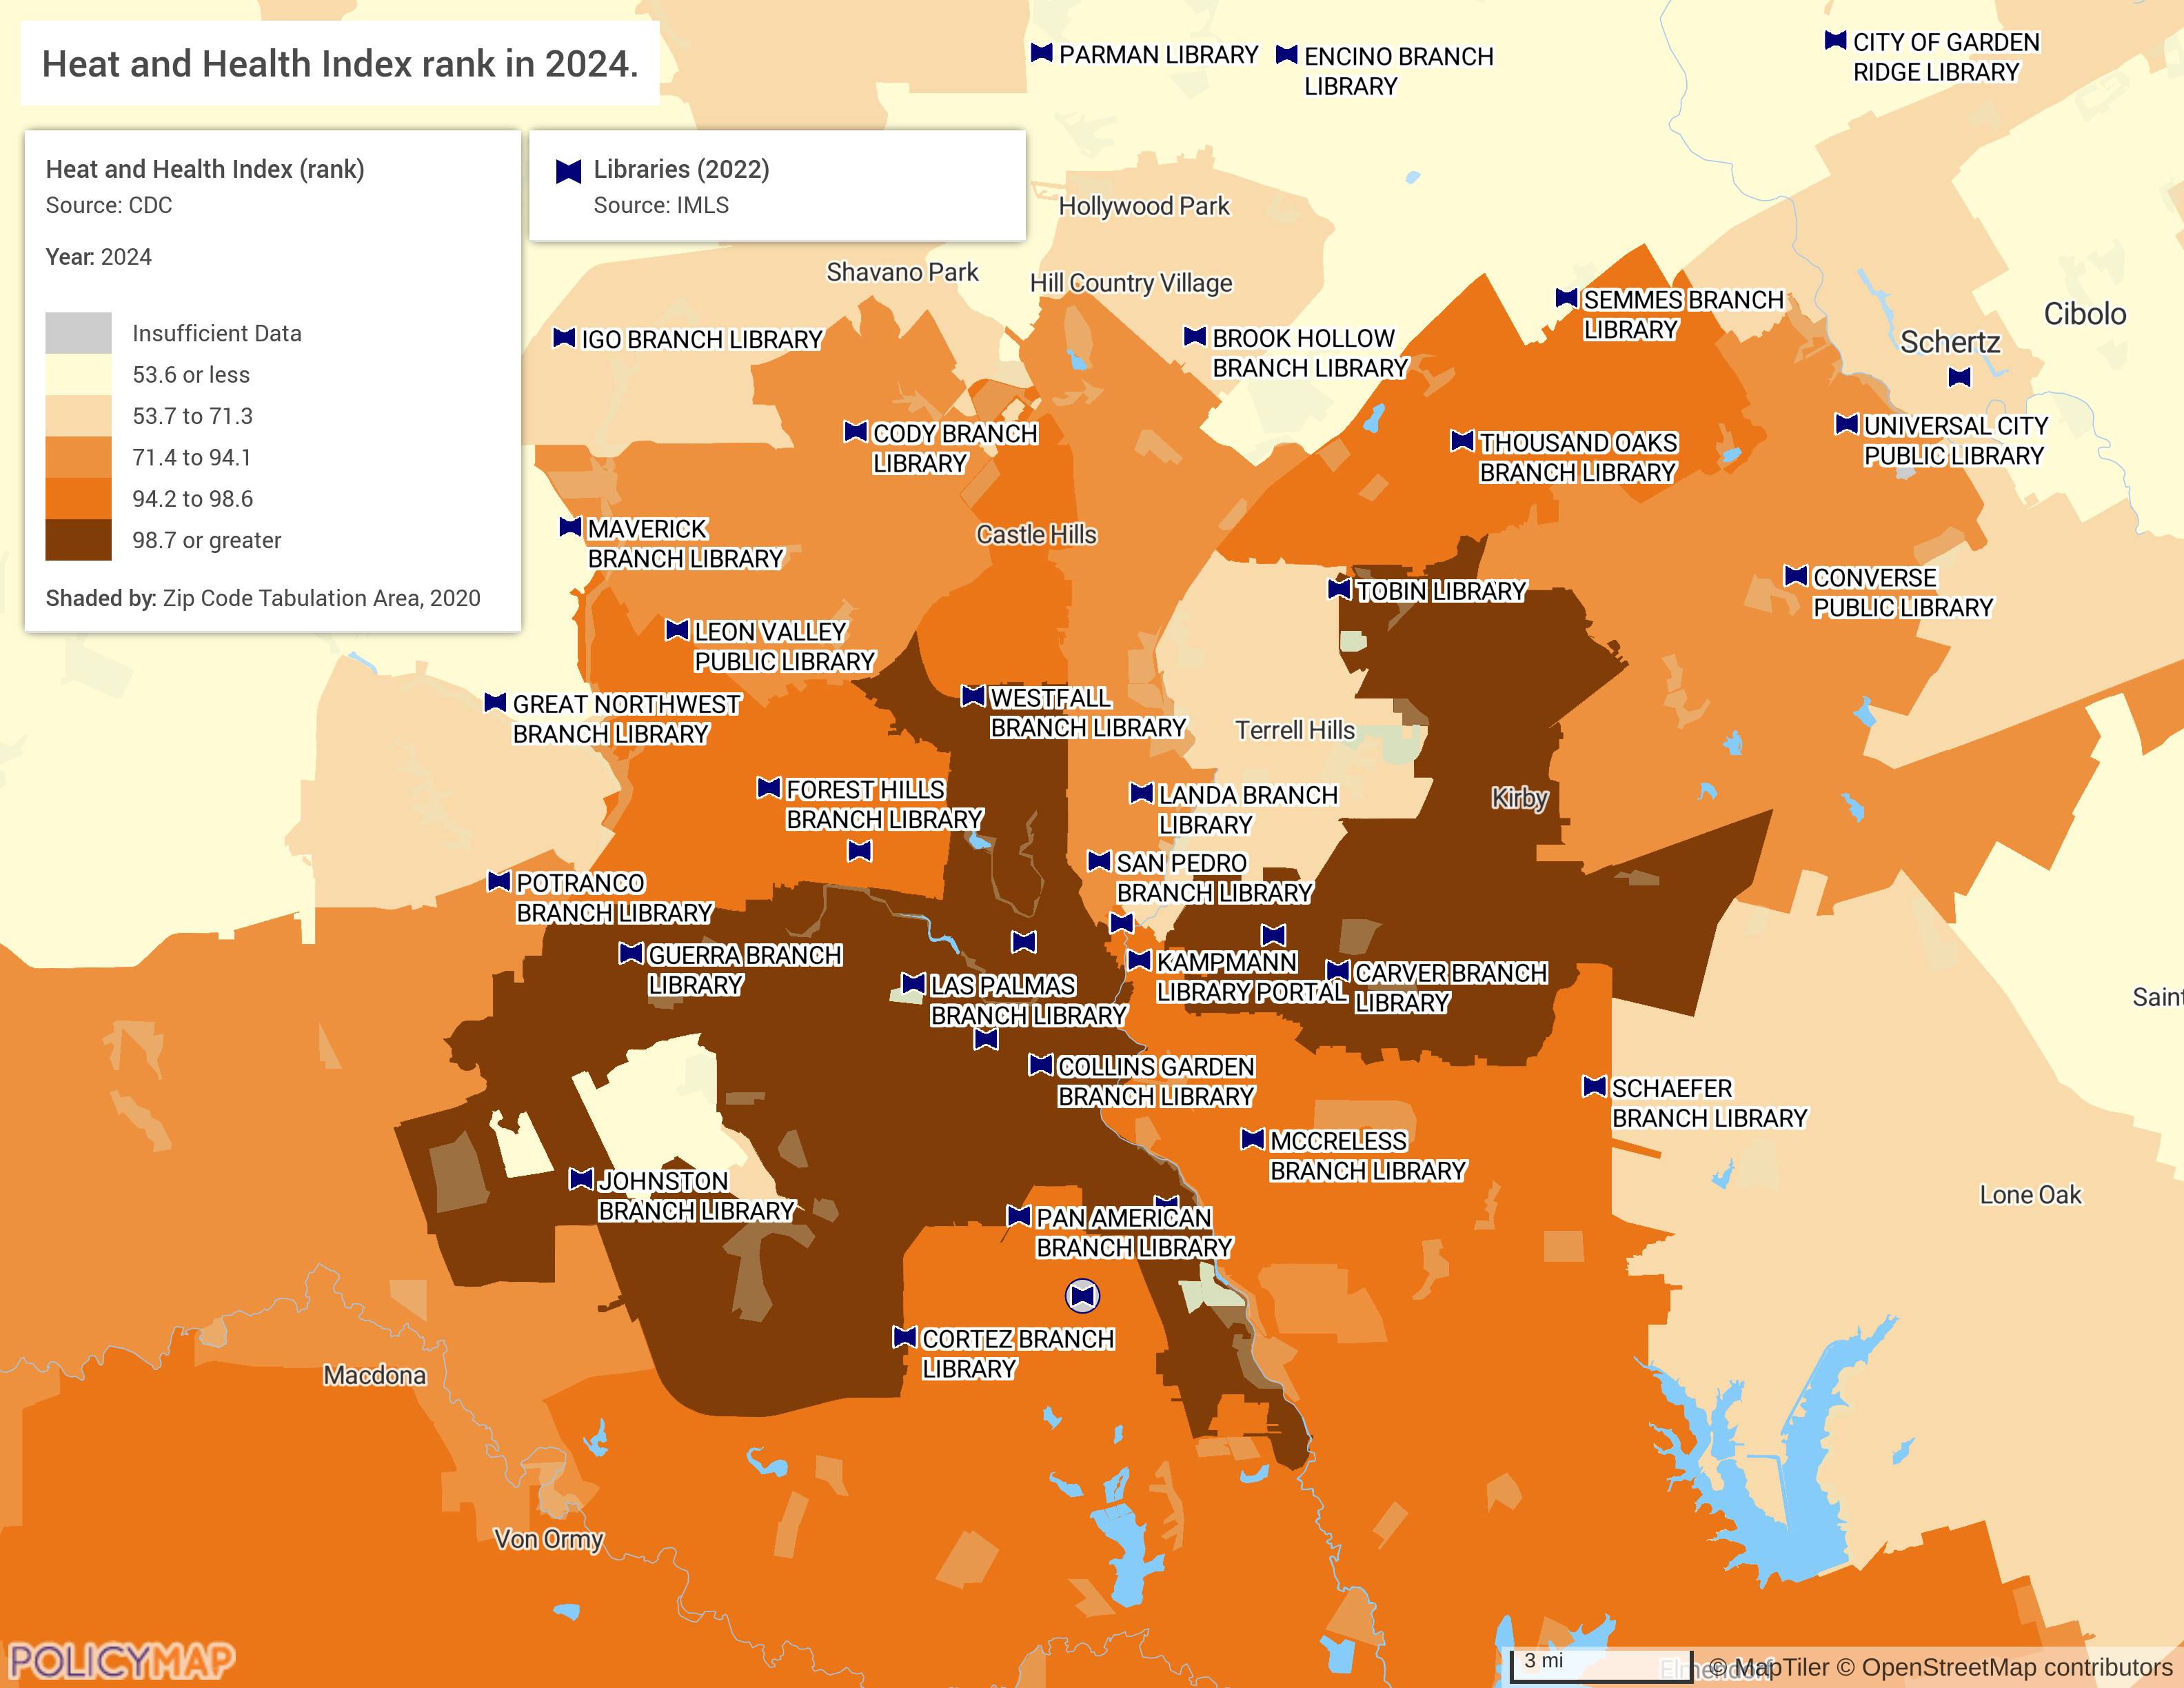
CDC Heat and Health Index Rank: This index identifies communities at the highest risk from extreme heat based on health, environmental, and demographic factors. This data is especially valuable for informing public cooling strategies, such as designating libraries as cooling centers during heat waves.
FEMA National Risk Index (NRI): This index combines data on natural hazards, community resilience, and expected annual losses to provide a composite picture of risk across the U.S. It helps identify where natural disasters are likely to have the most severe impacts, guiding mitigation and resource allocation.
Reinvestment Fund’s Limited Supermarket Access (LSA) analysis: When combined with spatial data on grocery store proximity and public transit routes, this identifies food deserts and transportation-challenged areas—essential for disaster logistics and equitable resource distribution.

Infrastructure data layers: These include broadband access, flood zones, housing condition indicators, brownfields, superfund sites, and more—offering insight into the structural vulnerabilities that can amplify disaster impacts or hinder recovery.
Viewed together, these datasets allow for a more comprehensive understanding of community risk, resilience, and need. They also empower public institutions—especially libraries—to respond with intention. Libraries can serve as trusted hubs during crises: cooling centers during heat events, information access points during outages, and safe, inclusive gathering places for recovery and support.
Libraries also use mapping tools to better understand what’s present and missing in their communities. By layering public datasets with address-level data they upload themselves, libraries can create detailed, localized maps that highlight assets and gaps such as:
- Public libraries and academic institutions, including Head Start centers
- Community health centers and hospitals
- Mental Health Treatment Facilities
- Drug and Alcohol Treatment Facilities
- Pharmacies and retail-based healthcare
- SNAP retail locations
- Local Nonprofits
This approach helps identify where services are missing or stretched—and where new partnerships or mobile solutions could make the most significant impact.
From Crisis to Coordination
The evidence is clear: Libraries aren’t just ready to help—they’re already doing the work. They provide the data, tools, and trusted spaces communities need to prepare, respond, and recover. Include them in disaster planning, and the whole community benefits.
Mapping vulnerability and mapping relief go hand in hand. With tools like PolicyMap, libraries and their partners can ensure that the most people who need help are seen and reached.