From Maps to Meaning: How Libraries Help Patrons Understand Their Communities

Public libraries evolve to meet the diverse needs of their communities, offering not just books and information but powerful tools for data analysis and community insights. Through platforms like PolicyMap, library patrons gain access to valuable community data, empowering small business owners, students, community advocates, and curious individuals alike to make informed decisions, address local issues, and pursue grant funding. Patrons can turn insights into impactful actions by exploring data on demographics, housing, workforce characteristics, health, and quality of life—making libraries true catalysts for community growth and change.
Let’s examine how library patrons use data tools to better understand and support their communities.
Using Demographics to Understanding Community Composition
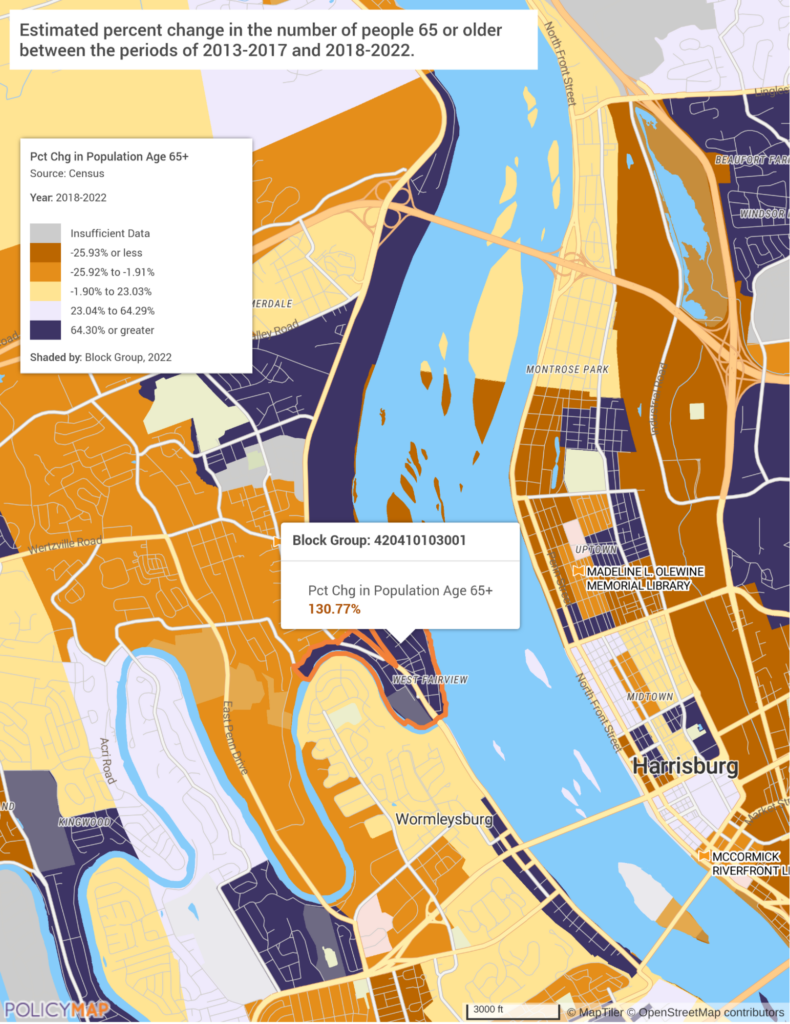
Demographic data helps patrons understand the people who live, work, and engage within their community. PolicyMap provides access to data on age, race, ethnicity, family structure, and income levels, allowing patrons to assess population dynamics and identify the characteristics unique to their neighborhoods. This data can be critical for individuals seeking to develop community projects, initiate local services, or gain insights into their surroundings.
Use Case: A local nonprofit volunteer uses PolicyMap’s demographic data to assess her community’s age distribution and income levels. She finds a high concentration of senior residents in her area. Armed with this data, she advocates for programming at the local community center to address the needs of older adults, gaining the support of local officials who now see the demographic evidence.


Housing: Navigating Affordability and Stability
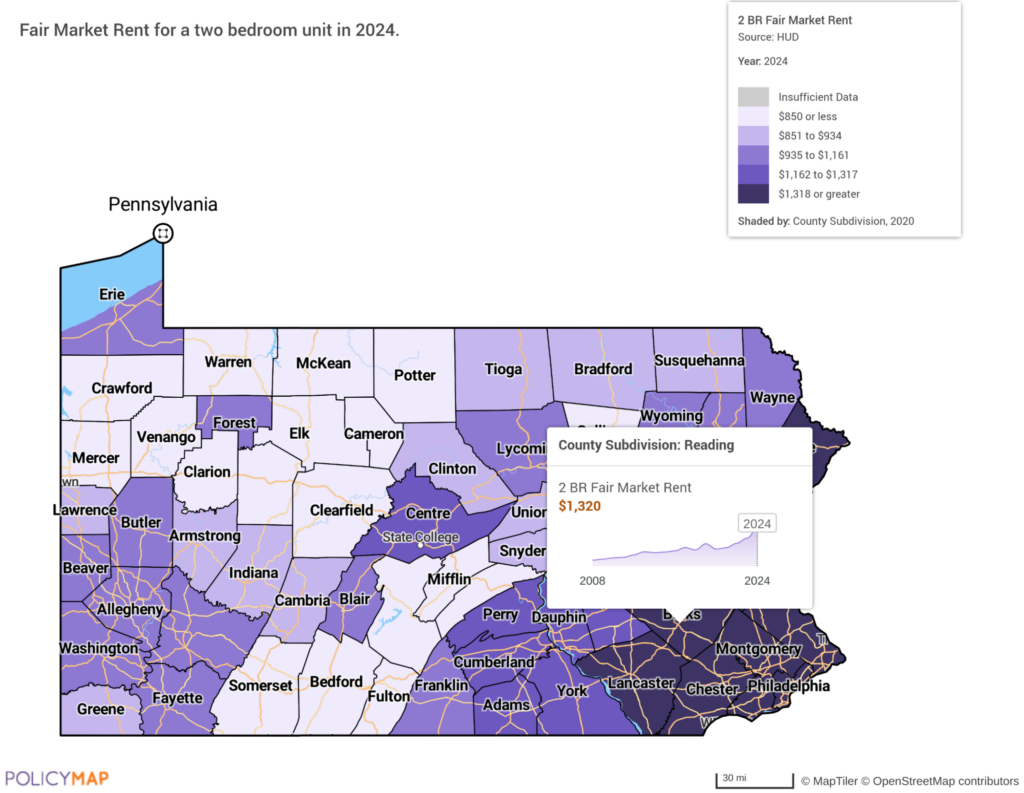
Access to housing data—such as affordability metrics, homeownership rates, and housing conditions—enables patrons to understand the state of housing in their communities. This information benefits those involved in community development or anyone seeking affordable housing options.
Use Cases: A first-time homebuyer uses PolicyMap at the library to explore median home prices and rental rates in nearby neighborhoods. By comparing these insights, he can identify areas with affordable options that meet his needs, making his home-buying journey more informed and targeted.
In another case, a community group working to support housing stability uses PolicyMap to understand rental cost trends. They identify high rental prices in specific neighborhoods and use this information in a grant proposal for rental assistance, helping to establish the local need and secure funding for their initiative.
Workforce Characteristics: Supporting Job Seekers and Economic Development
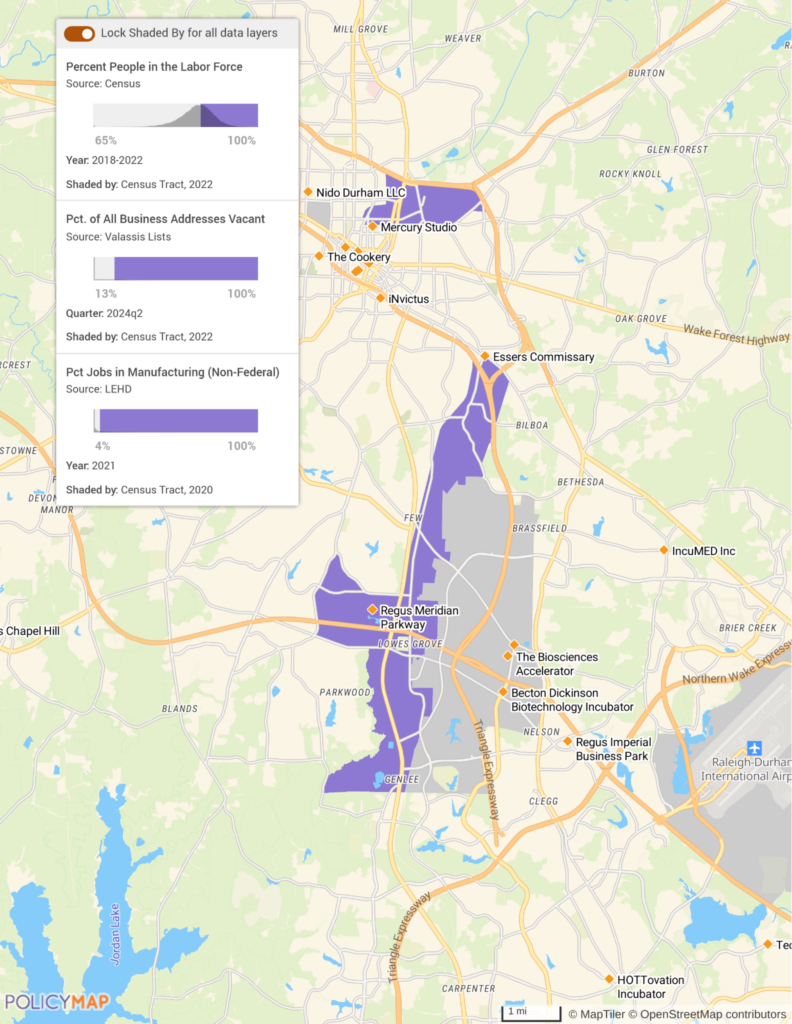
Understanding the local job market and the economic landscape can be crucial for patrons looking to grow professionally or support local business development. PolicyMap’s workforce data includes employment rates, income levels, workforce characteristics, and educational attainment, enabling patrons to assess economic trends and make informed decisions.
Use Cases: A recent college graduate explores workforce data on PolicyMap to identify industries with job growth in his area. By analyzing income levels and educational requirements, he refines his job search, identifying sectors that align with his skills and goals. This targeted approach helps him make strategic career moves within his community.
An entrepreneur looking to open a new business in town leverages data tools to identify areas with high employment rates and a strong presence of young professionals. Her research helps her pinpoint a location that aligns with her target audience, increasing the likelihood of her business’s success. Workforce characteristics data provides insights into workers by industry sector, educational attainment, and age, while business and vacancy data add context. Additionally, location data for Small Business Development Centers and Business Incubators is available, offering further support for her venture.
Health: Addressing Public Health Needs
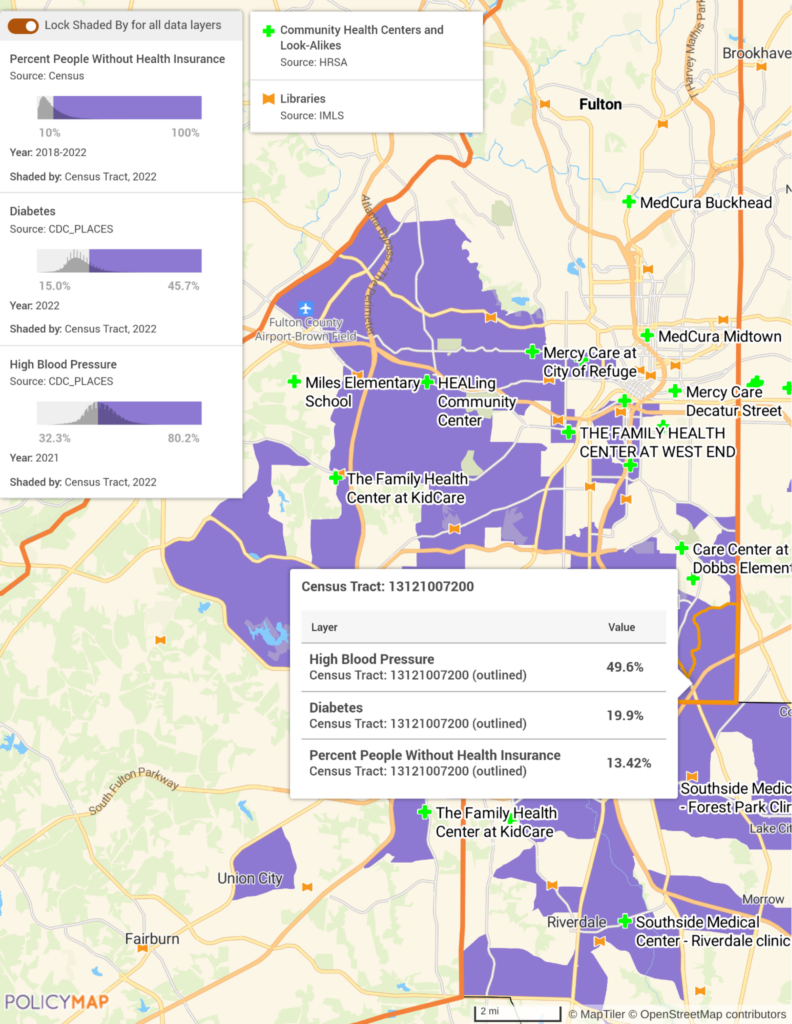
Health data, including indicators such as insurance coverage, prevalence of chronic illnesses, and access to healthcare facilities, is valuable for patrons interested in wellness and public health advocacy. PolicyMap’s health data helps users identify areas with healthcare gaps or significant health concerns, enabling informed decisions that can improve public health.
Use Case: A small business owner planning to open a wellness center in her town uses health data to assess the community’s needs. By analyzing indicators such as insurance coverage, rates of chronic illnesses like diabetes and high blood pressure, and the proximity of healthcare facilities, she identifies neighborhoods with limited access to wellness services and a high prevalence of these conditions. Armed with these insights, she tailors her business plan to focus on preventative care and health education workshops, ensuring her wellness center addresses specific community health gaps. This data-driven approach strengthens her business proposal and enhances her center’s impact on community wellness.
Quality of Life: Enhancing Environmental Justice, Digital Access, and Community Amenities
PolicyMap’s quality of life indicators cover a range of issues, from environmental data and digital access to recreational facilities and food security. Patrons interested in community quality of life can use this data to support social justice, advocate for infrastructure improvements, and promote environmental sustainability.
Use Case: A resident concerned about environmental conditions uses PolicyMap to examine environmental burden and the locations of brownfields near schools in her area. By overlaying the Environmental Justice Index Rank data with demographic information, she finds that specific neighborhoods with high populations of young children are also close to high-pollution sites. She organizes a community effort to address these environmental justice concerns, advocating for cleaner air standards and additional green spaces around schools.
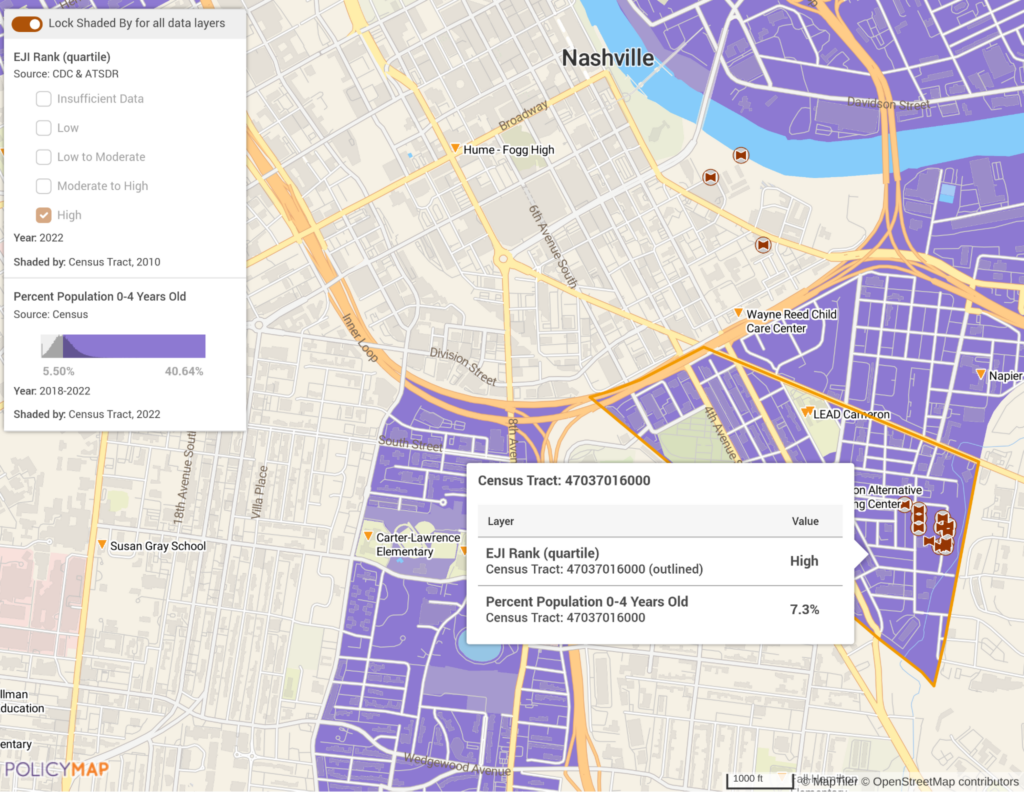
Grant Writing Application: A library patron working with a digital equity group uses PolicyMap to document internet access gaps in underserved areas of the community. The data shows an apparent lack of broadband availability in lower-income neighborhoods, strengthening their grant proposal to fund public Wi-Fi hotspots and student internet access programs. Using precise data on digital access disparities, they build a robust and evidence-based application that aligns with the funder’s goal to bridge the digital divide.
Public Libraries as Data Champions
By offering tools like PolicyMap, libraries empower patrons with data access and literacy, supporting informed decisions and community engagement. Libraries bridge the gap between complex information and actionable insights, helping patrons become informed advocates who drive positive change. Through these resources, patrons learn to navigate challenges, advocate for resources, and support community growth—fulfilling libraries’ role as centers of learning and empowerment.
Request More Information
For libraries looking to expand their reach and impact through patron-facing tools, PolicyMap offers a valuable resource for making data-driven decisions that can enhance service delivery and community satisfaction.
Interested in learning more about how PolicyMap can elevate the offerings of public libraries for the betterment of their communities? Fill in the form below to learn more or schedule a demo.