
Reinvestment Fund Market Value Analyses (MVAs)
| Categories | Business Characteristics & Markets, Housing & Real Estate |
|---|---|
| Detail | Reinvestment Fund real estate market evaluation and valuation for Philadelphia, Baltimore, Washington DC, Milwaukee, Jacksonville, Kansas City, Houston, Dallas and areas of the state of New Jersey |
| Download Available | yes |
| Public Edition or Subscriber-only | Public Edition |
| Source | Reinvestment Fund |
| Years Available | various |
Description:
Reinvestment Fund’s Market Value Analyses (MVAs) are typologies of local real estate markets, designed to help governments and private investors target investment and prioritize action in ways that can leverage investment and revitalize neighborhoods. To develop this analysis, Reinvestment Fund uses a statistical technique known as cluster analysis that helps to uncover patterns in data. Cluster analysis does this by forming groups of areas that are similar along a set of selected values that describe those areas. While the groups are formed to be as uniform as possible within, the groups are also as dissimilar as possible from one another. Using this technique, the MVA is able to reduce vast amounts of data on hundreds of thousands of properties and hundreds of areas down to a manageable, meaningful typology of market types that can inform area-appropriate programs and decisions regarding the allocation of resources. Reinvestment Fund uses many indicators in its analyses including various combinations of the following: average home sale price, percent change in average home sale price over time, percent owner occupancy, percent vacancy, percent vacant lots, percent of rental units that are Section 8, percent commercial, percent of properties with foreclosure, percent prime home purchase loans, number of new construction permits, number of Sheriff sales as a percent of owner occupied units, number of public housing units, percent of properties deemed dangerous, percent of structures demolished, percent of high risk or very high risk credit scores for predatory lending, and percent of housing units built before 1950.
Working with the MVA client, Reinvestment Fund forms geographic study areas for the cluster analysis. Although many of these study areas are displayed using similar color schemes, they can not be compared. Please consult the description relevant to the study area for a full description of each MVA.
FLORIDA
Jacksonville, FL (2018)
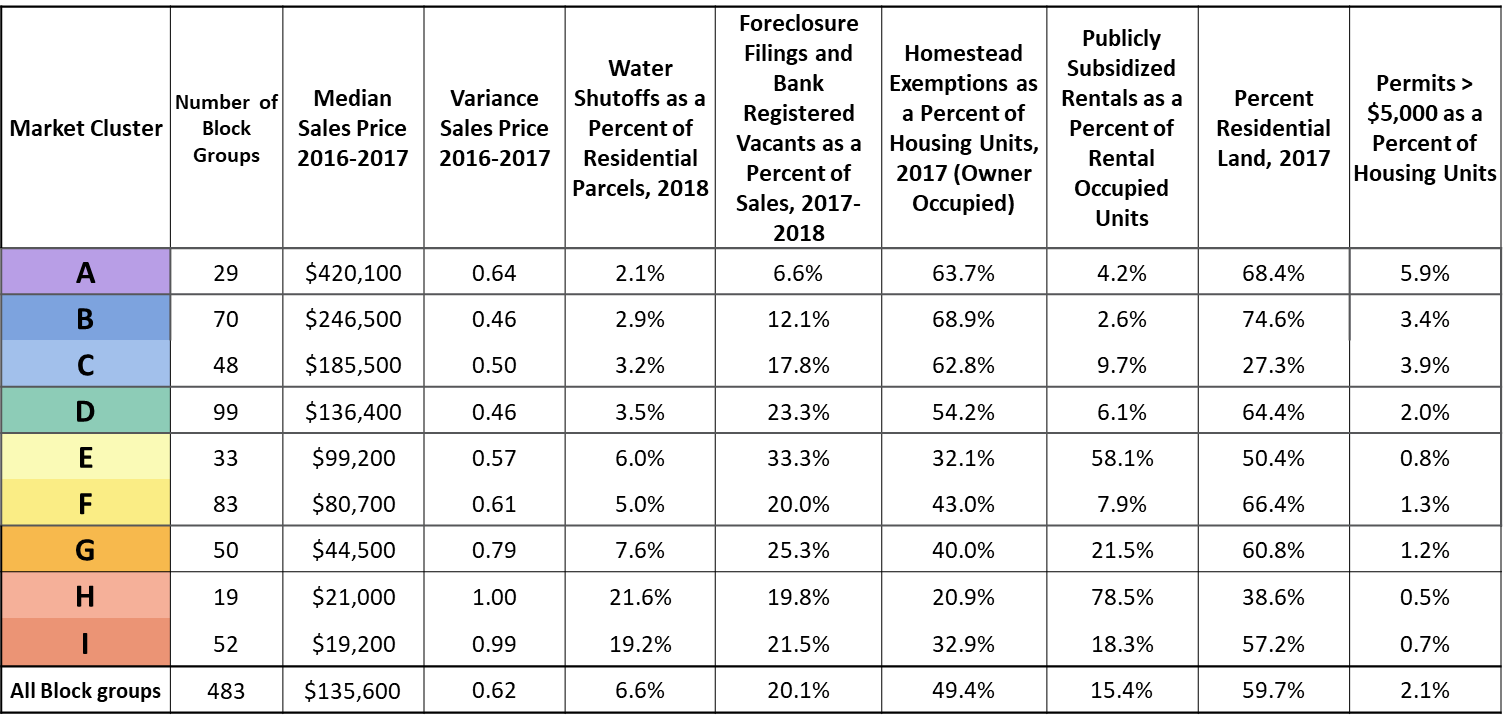
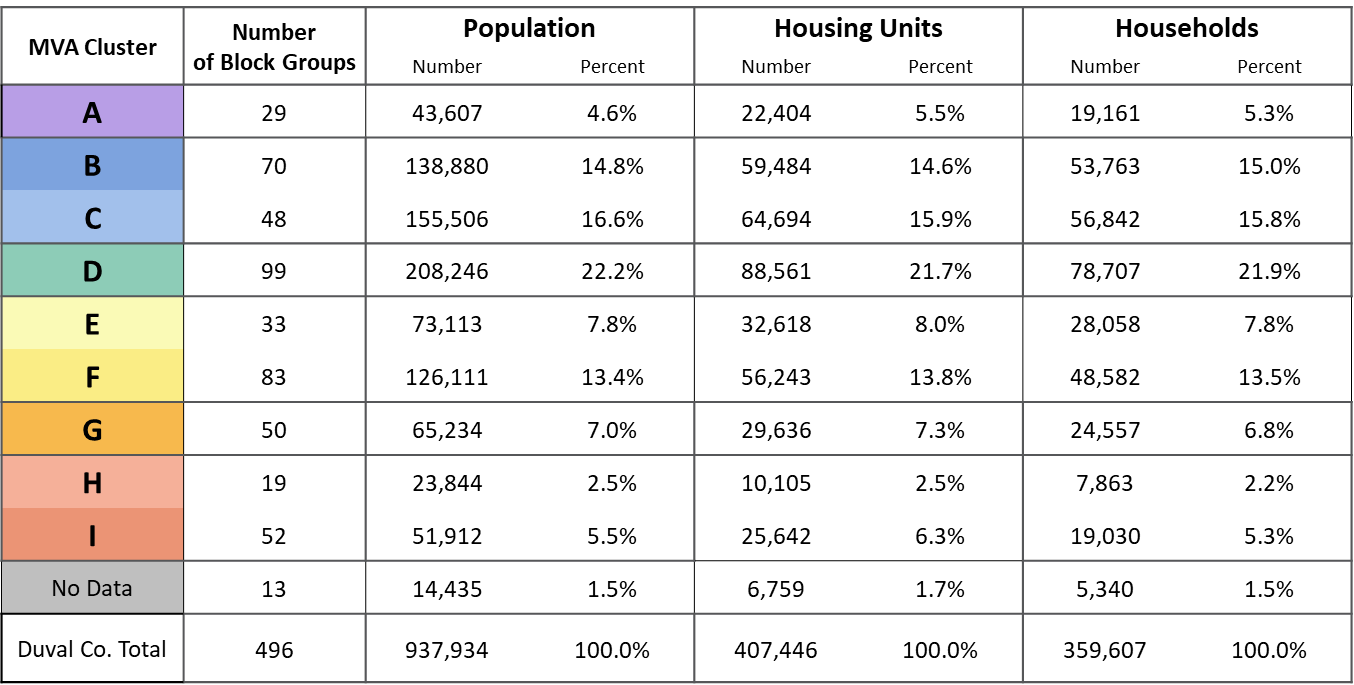
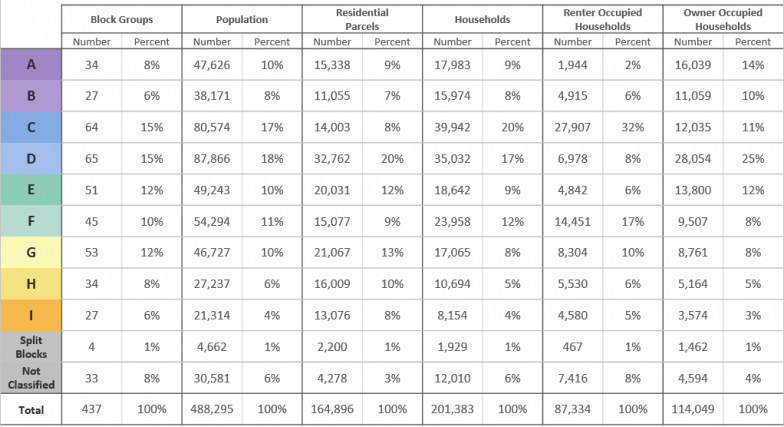
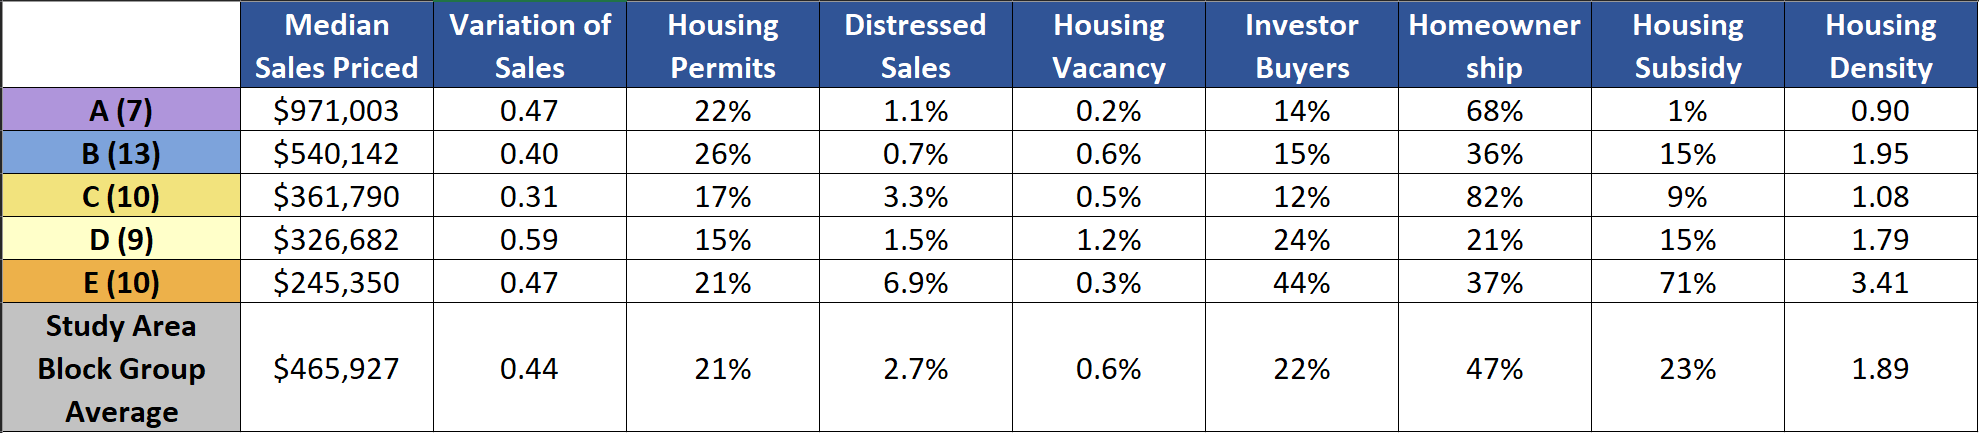
Reinvestment Fund’s Market Value Analysis (MVA) describes the characteristics of the block groups within a study area. In 2018, Reinvestment Fund updated the Market Value Analysis in Jacksonville. The MVA indicators in Duval County are noted below and represent the dimensions upon which block groups are analyzed:
- Median Sales Price: Duval County Property Appraiser’s file of all recorded sales between 1/1/2016 through 12/31/2017 for residential sales of $1,000 or more.
- Coefficient of Variation: The coefficient of variation, derived from the Duval County Property Appraiser’s file of sales, represents the variability of sale prices within the block group. (High numbers represent places with wide variations in sale prices.)
- Foreclosure as a Percent of Sales: Foreclosure filings (Duval County Clerk of Court) were added to a Duval County file of bank-owned, registered vacant properties in 2018. This figure is then divided by the number of sales in 2016-2017 (from County Assessor’s file).
- Percent Water Shut-off: JEA file of properties where water service has been shut off divided by the total number of residential properties. This is an indicator of vacancy.
- Percent >$5K Rehab: Duval County records of all building permits issued between 1/1/2016 through 12/31/2017 for new construction and substantial rehabilitation (estimated value greater than $5,000) of properties divided by the total number of residential parcels.
- Percent Homestead Exempt: Duval County Parcel File, total number of residential properties claiming a Homestead Exemption divided by the number of residential parcels.
- Percent Publicly Subsidized Rental: Represents Duval County and City of Jacksonville Housing Authority owned developments, and HUD-assisted rental housing developments including Housing Choice Vouchers (aggregated to the Census Block Group by the Shimberg Center for Housing Studies, University of Florida), divided by the number of renter-occupied housing units (ACS 2016).
- Percent Residential Area: Duval County Property Appraiser’s File. This figure represents residential land divided by all developable land area.
 Reinvestment Fund cluster analysis revealed nine market types, characterized as follows:
- Market Type A: Highest home prices, lowest number of foreclosure filings relative to sales volume (foreclosure rate), high owner occupancy rate, highest level of permit activity, lowest rate of water shut-offs.
- Market Type B: High home prices, second lowest foreclosure rate relative to sales volume but about twice the rate as Market A, highest percent owner occupied, lowest coefficient of variance of sales price.High home prices, second lowest foreclosure rate relative to sales volume but about twice the rate as Market A, highest percent owner occupied, lowest coefficient of variance of sales price.
- Market Type C: Relatively high home prices, lowest percentage of residential land area, second highest rate of permit activity.
- Market Type D: Home prices close to the citywide average, low sales price variance, foreclosures as a percentage of sales a bit higher than the citywide average.
- Market Type E: Second lowest percentage of properties with homestead exemptions, second highest percentage of publicly subsidized rentals, foreclosures as a percent of sales higher than the citywide average.
- Market Type F: Home prices slightly more than half the citywide average, about average foreclosures as a percent of sales, fewer Homestead Exemptions than average, and utility shut-offs slightly below the citywide average.
- Market Type G: Third lowest homeownership rate, higher than average percent of publicly subsidized rentals, home prices roughly a third of the citywide average, high number of foreclosures as a percent of sales, percent water shut-offs that are higher than the citywide average.
- Market Type H: Second lowest home sale prices, highest coefficient of variance of sales, lowest owner occupancy rate, highest percent of publicly subsidized rental, highest percent water shut-offs.
- Market Type I: Lowest home sale prices, second lowest owner occupancy rate, second highest coefficient of variance of sales, second highest percent water shut-offs.
- Nonresidential Mask: All nonresidential parcels>50,000sf in the Duval County Property Appraiser’s file were merged to create a non-residential mask for the county.
- Insufficient Data: All block groups that had fewer than 5 sales in 2016-2017; these block groups tend to be either entirely rental housing or non-residential uses.
Jacksonville, FL (2015)
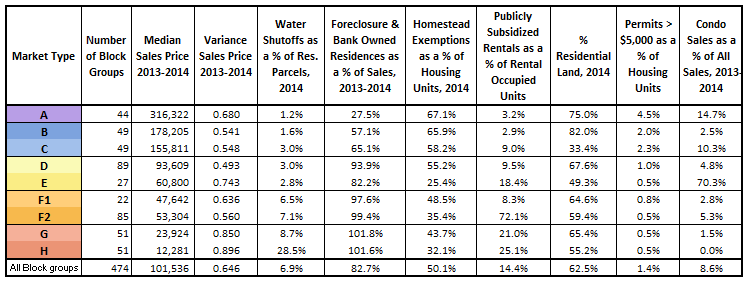
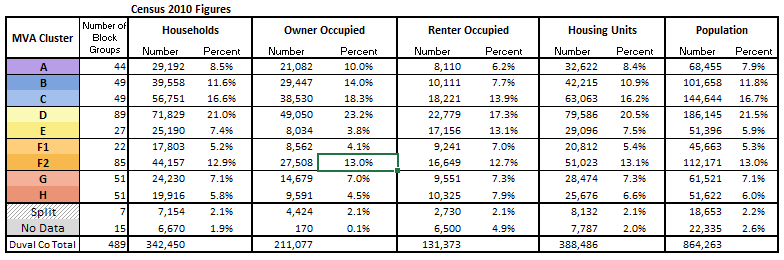
Reinvestment Fund’s Market Value Analysis (MVA) describes the characteristics of the block groups within a study area. The MVA indicators in Jacksonville are noted below and represent the dimensions upon which block groups are analyzed:
- Median and Average Sales Price: Duval County Property Appraiser’s file of all recorded sales between 1/1/2013 through 12/31/2014 for residential sales of $1,000 or more. Only the Median Sale Price was used in the MVA model.
- Coefficient of Variation: The coefficient of variation, derived from the Duval County Property Appraiser’s file of sales, represents the variability of sale prices within the block group. (High numbers represent places with wide variations in sale prices.)
- Foreclosure as a Percent of Sales: Florida is a non-judicial foreclosure state; foreclosures had to be estimated by using Duval County Property Appraiser’s Office sales data to note properties that were sold to banks, along with a Duval County file of bank-owned, registered vacant properties 2013 through 2014. This figure, a rough estimate of foreclosure filings, is then divided by the number of sales in 2013-2014 (from City Assessor’s file).
- Percent Water Shut-off: Duval County Water Department file of properties where water service has been shut off divided by the total number of residential properties. This is an indicator of vacancy.
- Percent >$5K Rehab: Duval County records of all building permits issued between 1/1/2013 through 12/31/2014 for new construction and substantial rehabilitation (estimated value greater than $5,000) of properties divided by the total number of residential housing units (ACS 2013).
- Percent Homestead Exempt: Duval County Parcel File, total number of residential properties claiming a Homestead Exemption divided by the number of residential Housing Units according to ACS 2013. This represents the percent of all occupied housing units that are occupied by owners.
- Percent Publicly Subsidized Rental: Represents Duval County and City of Jacksonville Housing Authority owned developments, and HUD-assisted rental housing developments including Housing Choice Vouchers (aggregated to the Census Block Group by the Shimberg Center for Housing Studies, University of Florida), divided by the number of renter-occupied housing units from the City Parcel File.
- Percent Residential Area: Duval County Property Appraiser’s File. This figure represents residential land divided by all developable land area.
 Reinvestment Fund cluster analysis revealed nine market types, characterized as follows:
- Market Type A: Highest home prices, lowest number of foreclosure filings relative to sales volume (foreclosure rate), highest owner occupancy rate, highest level of permit activity, lowest rate of water shut-offs, second highest percentage of sales that are condominiums.
- Market Type B: High home prices, second lowest foreclosure rate relative to sales volume but over twice the rate as Market A, second highest percent owner occupied, second lowest coefficient of variance of sales price, very low percentage of condominium sales.
- Market Type C: Relatively high home prices, notably higher rates of utility shut offs compared to A and B markets, lowest percentage of residential land area, third highest percentage of condo sales.
- Market Type D: Home prices close to the citywide average, lowest sales price variance, foreclosures as a percentage of sales a bit higher than the citywide average.
- Market Type E: Largely a condominium market, highest percentage of condo sales by a large margin, lowest percentage of properties with homestead exemptions, percentage of publicly subsidized rental approximately twice the rate as D and F1 markets, foreclosures as a percent of sales matches the citywide average.
- Market Type F1: home prices slightly less than half the citywide average, higher foreclosures as a percent of sales than the citywide average, Homestead Exemptions near the citywide average, utility shut-offs at twice the rate of markets A-E.
- Market Type F2: Second lowest homeownership rate, highest percent of publicly subsidized rental by nearly three times the rate as the next highest market (H), home prices roughly half the citywide average, high number of foreclosures as a percent of sales, highest percentage of sales that are multi-unit, percent water shut-offs that are close to the citywide average but twice the rate of markets A-E.
- Market Type G: Second lowest home sale prices, sales prices roughly half that of the F markets, second highest coefficient of variance of sales, third highest percent of publicly subsidized rental, percent water shut-offs that are higher than the citywide average, second lowest percentage of condominium sales.
- Market Type H: Lowest home sale prices, sales prices roughly half that of the G markets, highest vacancy rate, second lowest owner occupancy rate, highest coefficient of variance of sales, highest percent water shut-offs, water shut offs are over three times the rate of the next highest market (H), no condo sales recorded
- Nonresidential Mask: All nonresidential parcels>50,000sf in the Duval County Property Appraiser’s file were merged to create a non-residential mask for the county.
- Insufficient Data: All block groups that had fewer than 5 sales in 2013-2014; these block groups tend to be either entirely rental housing or non-residential uses.
GEORGIA
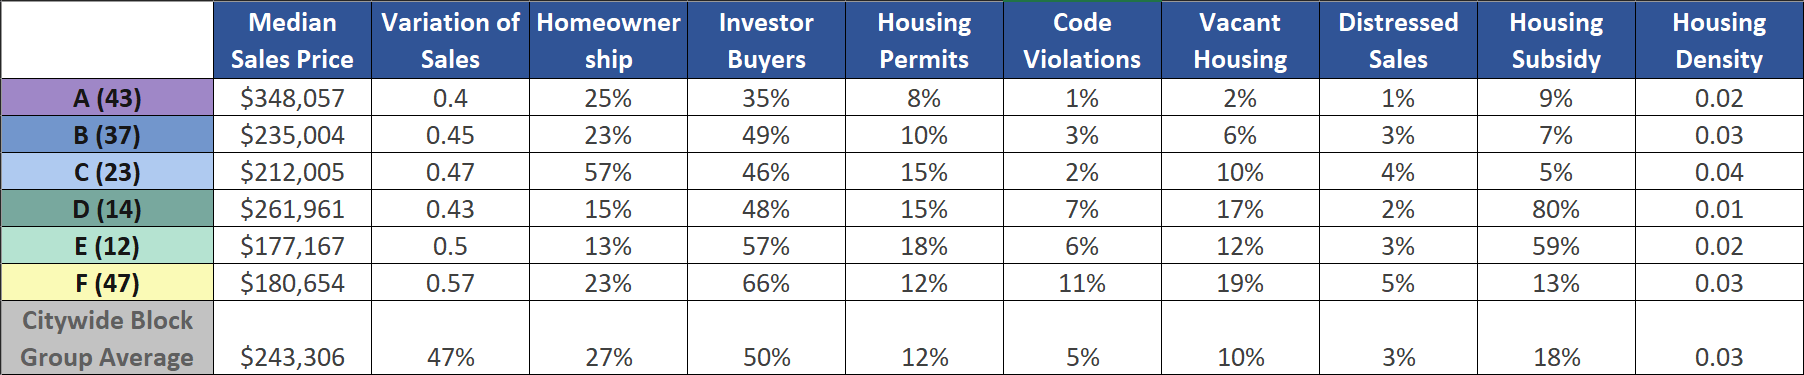
Atlanta, GA (2024)
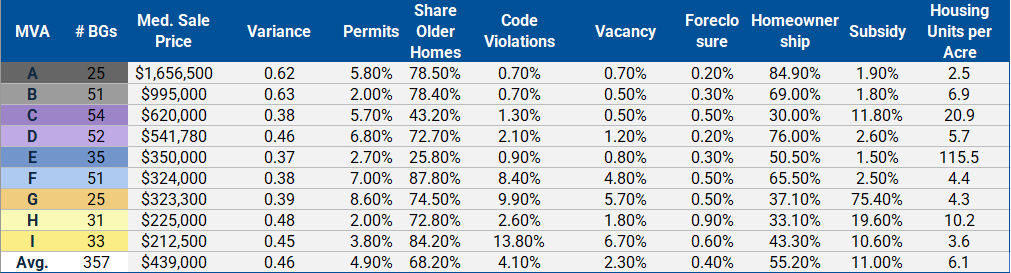
Reinvestment Fund’s Market Value Analysis (MVA) describes the characteristics of the block groups within a study area. In 2024, Reinvestment Fund updated the Market Value Analysis in Atlanta. The MVA indicators in Atlanta, GA are noted below and represent the dimensions upon which block groups are analyzed:
- Median Sales Price: The typical value of residential home sales between 2022-2023, excluding homes purchased for values below $1,000 or above $5,000,000 (Condo adjusted).
- Variation of Sales Price: Variation of home values between 2022-2023 (Standard Deviation / Average Value).
- Housing Units with Renovation or New Construction Permit: Share of housing units with permits issued between 2022 and 2023, including new multifamily buildings.
- Code Violations: Share of housing units with maintenance violations, 2022-2023.
- Foreclosure Auction Filings: Share of owner occupants who had a foreclosure auction filing between 2022-2023, 2024.
- Vacant Housing: Share of residential parcels that were found vacant during surveys or by the Postal Service, Q1 2024.
- Age of Homes: Share of housing units built before 2000, 2018-2022.
- Owner Occupied Households: Share of owner occupied households, 2018-2022.
- Households with Subsidy: Share of households with subsidy (LIHTC, Public Housing, HCV, Multifamily), 2024.
- Density of Housing Units: Housing Units Per Acre of Residential Land, 2018-2022.
 Reinvestment Fund cluster analysis revealed nine market types, characterized as follows:
- Market Type A: These markets have the highest home sale prices and the highest rates of homeownership, high permitting levels, and large lots (i.e. low density). There is little indication of housing distress (such as code violations, vacancy and foreclosures).
- Market Type B: These markets have very high home sale prices, high shares of homeowners, low permitting levels, and some multifamily buildings. There is little indication of housing distress (such as code violations, vacancy and foreclosures).
- Market Type C: These markets have elevated home sale prices and have experienced a lot of building since 2000, as they have the lowest share of older homes. They also have low levels of homeownership and housing distress, and some households are able to access subsidized housing.
- Market Type D: These markets have elevated home sale prices and very high permitting and homeownership levels. There is some code violation activity and vacancy.
- Market Type E: These markets have housing sale prices a little below the citywide average. They have had the highest shares of new building since 2000, including many multifamily buildings (as they have the highest housing density). There is an even mix of homeowners and renters.
- Market Type F: These markets have housing sale prices below average and substantial levels of permitting (the second highest in the city), with double the amount of code violations and vacancy compared to the typical block group. These areas are transitioning.
- Market Type G: These markets have below average housing sale prices and the highest permitting levels, with high shares of code violations and vacancy. They are also transitioning areas and are predominantly renter occupied. High shares of households have access to subsidized rental housing.
- Market Type H: These markets have low housing prices and the lowest level of permitting activity in the city, but also have low levels of code violations and vacancy. There is a high share of renters, and high share of households that can access subsidized rental housing.
- Market Type I: These markets have the lowest housing prices and the highest shares of code violations and vacancy, with high shares of older homes. Households are a mix between renters and homeowners, with slightly more renters, and some households can access subsidized housing.
- Nonresidential Mask: All nonresidential parcels>50,000sf in the Fulton County Property Appraiser’s file were merged to create a non-residential mask for the county.
- Insufficient Data: All census tracts that had fewer than 5 sales in 2023-2024; these census tracts tend to be either entirely rental housing or non-residential uses.
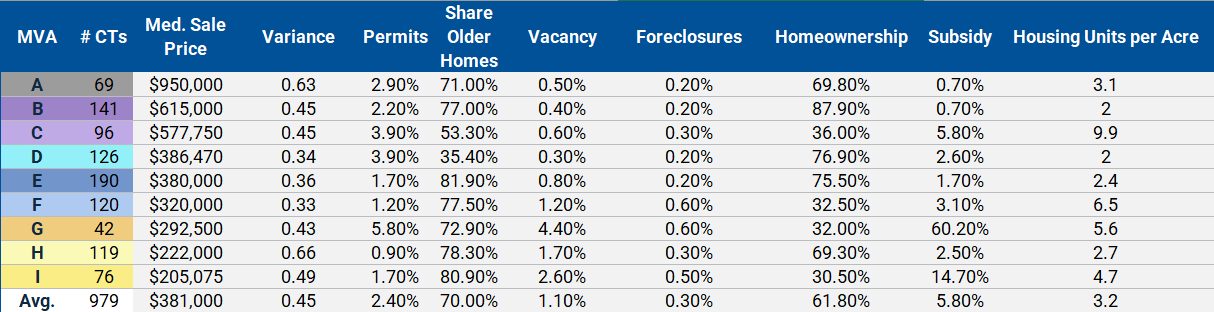
Atlanta Metro, GA (2024)
Reinvestment Fund’s Market Value Analysis (MVA) describes the characteristics of the census tracts within a study area. The MVA indicators in the Atlanta Metro region (Clayton, Cobb, DeKalb, Fulton, and Gwinnett counties) are noted below and represent the dimensions upon which census tracts are analyzed:
- Median Home Value: The typical value of residential home sales between 2022-2023, excluding homes purchased for values below $1,000 or above $5,000,000 (Condo adjusted).
- Variation of Sales Price: Variation of home values between 2022-2023 (Standard Deviation / Average Value).
- Housing Units with Renovation or New Construction Permit: Share of housing units with permits issued between 2022 and 2023, including new multifamily buildings.
- Foreclosure Auction Filings: Share of owner occupants who had a foreclosure auction filing between 2022-2023, 2024.
- Vacant Homes: Share of residential addresses that were vacant for 90+ days according to the US Postal Service, Q1 2024.
- Age of Homes: Share of housing units built before 2000, 2018-2022.
- Owner Occupied Households: Share of owner occupied households, 2018-2022.
- Households with Subsidy: Share households with subsidy (LIHTC, Public Housing, HCV, Multifamily), 2024.
- Density of Housing Units: Housing Units Per Acre of Residential Land, 2018-2022.
 Reinvestment Fund cluster analysis revealed nine market types, characterized as follows:
- Market Type A: These markets have the highest home sale prices, slightly elevated permitting levels, and very low levels of housing distress (vacancy and foreclosure).
- Market Type B: These markets have very high home sale prices and the highest share of homeowners. They are predominantly single-family homes, with low housing density and low levels of housing distress (vacancy and foreclosure).
- Market Type C: These markets have high home sale prices and high levels of permitting. Almost half of the units in these markets have been built since 2000. They are predominantly renter occupied and some households use a housing subsidy.
- Market Type D: These markets have average home sale prices and high permitting levels. They have experienced the highest shares of new building since 2000 and have low levels of housing distress (vacancy and foreclosure). They also have high rates of homeownership.
- Market Type E: These markets have average home sale prices and high shares of older homes, which are mostly owner occupied.
- Market Type F: These markets have about average home sale prices and high shares of older homes. They have high shares of renters, and average levels of vacancy and foreclosure.
- Market Type G: These markets have home sale prices below the regional average and have the highest shares of permitting, with high levels of vacancy. They are mostly renters and have high shares of households accessing subsidy.
- Market Type H: These markets have low housing prices and high shares of older homes. They have high levels of homeownership and elevated vacancy rates.
- Market Type I: These markets have the lowest home prices, high shares of older homes, and the highest share of renters. Vacancy and foreclosure rates are elevated, and some households can access housing subsidies.
- Nonresidential Mask: All nonresidential parcels>50,000sf in the Metro Atlanta County Property Appraiser’s file were merged to create a non-residential mask for the region.
- Insufficient Data: All block groups that had fewer than 5 sales in 2023-2024; these block groups tend to be either entirely rental housing or non-residential uses.
MARYLAND
Baltimore, MD (2017)
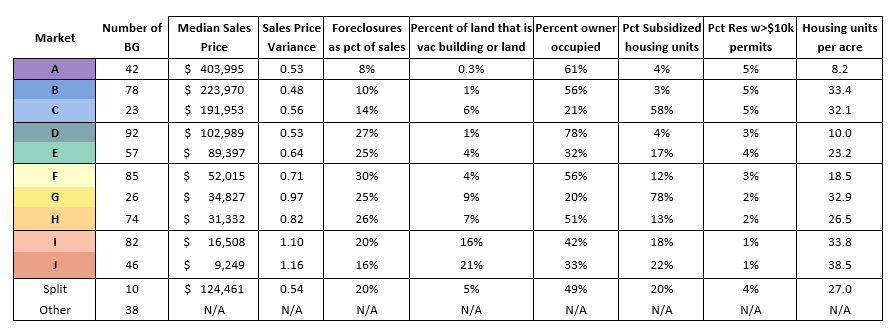
Reinvestment Fund’s Market Value Analysis (MVA) describes the characteristics of the block groups within a study area. In 2017, Reinvestment Fund updated the Market Value Analysis in Baltimore. The MVA indicators are noted below and represent the dimensions upon which block groups are analyzed:
- Median Sales Price: Median sales price of sales transactions that occurred between 2015q3 and 2017Q2. Median is calculated with and without condominium sales; the higher of the two values is used. Data from City of Baltimore.
- Sales Price Variation: The coefficient of variation, derived from the City of Baltimore’s file of sales, represents the variability of sale prices within the block group. (High numbers represent places with wide variations in sale prices.)
- Vacant Buildings and Vacant Lots: Percent of Residential Land Area that is either vacant Residential Land or occupied by Residential Properties that have been cited as vacant at any point in time from City records where the citation has not been “Closed” or “Abated”. Data from City of Baltimore.
- Foreclosure as a Percent of Sales: Mortgage foreclosure filings between 2015q3 and 2017q2, as a share of residential sales for the same period. Data from the City of Baltimore.
- Building Permits: Properties with building permits totaling $10,000 or more between 2015q3 and 2017q2. As a share of total residential parcels. Data from City of Baltimore.
- Residential Density: Residential housing units per residential land acre. This includes vacant and unoccupied residential properties. Data from City of Baltimore.
- Owner Occupancy: Percent of occupied housing units reported as owner occupied. Data from 2012-2016 Census American Community Survey (ACS).
- Subsidized Housing: Number of rental units with subsidies as a share of all housing units (HUD MF, LIHTC, HCV, HABC, Elderly, 202). Data from City of Baltimore and HUD.
 Reinvestment Fund cluster analysis revealed ten market types, characterized as follows:
- Market Type A: The typical home sales price in “A” markets is approximately 5 times the City median of $75,000. These markets have the second highest average percentage of properties (5.0%) that have over $10,000 in building permits during 2015q3-2017q2. Households in these “A” markets tend to be moderately owner occupied. “A” markets also have the lowest level of foreclosure filings as a percent of sales (7.7% of sales) in the city. On average, there are few publicly subsidized rental housing options in these markets (2.9% of all rental units). “A” markets are the least dense housing market with an average only 8.2 housing units per residential acre.
- Market Type B: At nearly $223,970, the “B” markets’ typical home sales price is just under two times the city median. Permitting activity (4.8%) is less than that in “A” markets, and is much higher than the city average. Differing from “A” markets, these “B” markets are slightly less owner occupied (55.9%). Of the rental households, an average of 2.4% per block group are receiving public subsidy. “B” markets typically have higher vacancy (1.0%) than “A” markets but far are below the city average (6.8%).
- Market Type C: Baltimore city’s “C” markets have home sale prices ($191,953) above the city average. Permitting activity (5.2%) is the highest in the city. “C” markets are minimally owner occupied (21.2%); of the large number of rental properties, a majority (57.7%) are publicly subsidized. With an average vacancy rate of 5.8%, “C” markets rank in the middle of the market types.
- Market Type D: The typical home sale prices in “D” markets ($102,989) is closest to the city average. Permitting activity in “D” markets (3.5%) is also just over the city average. “D” markets have the highest average homeownership rate (78.1%) and the third lowest density (10.0 units per acre) of all markets. “D” markets have the third lowest average vacancy in the city (1.4%), and comprise over 8,207 rental households, with an average of 3.7% receiving some form of subsidy.
- Market Type E: “E” markets block groups typical home sales price is approximately $89,397, roughly 20% below the city average. The market is moderately (32.2%) owner occupied, third lowest in the city. Permitting activity in “E” markets (3.6%) is slightly above the city average. The vacancy rate in “E” markets (3.8%) is the fourth lowest in the city.
- Market Type F: The typical home sales price in “F” markets is approximately $52,015, less than half of the city average, and foreclosure filings represent 30.3% of all sales. Permitting activity in “F” markets (2.6%) is the fifth lowest rate in the city. These markets are nearly evenly split between owners (55.8%) and renters. Of the renter households, an average of 11.9% per block group are receiving public subsidy; the fourth lowest level in the city.
- Market Type G: At $34,827, typical home sales prices in these “G” markets are almost two-thirds below the city average. In a typical block group, nearly 24.5% of all sales are by banks. An average of 20.1% of households own their home, the lowest average of all markets. Of the renter occupied households, on average 77.8% of them are subsidized, the highest average of all markets. At 9.1%, “G” markets have the third highest vacancy rate of all market types. Permitting activity in “G” markets (2.5%) is below the city average.
- Market Type H: The typical home sales price in “H” markets is $31,332, just below two-thirds the city average. On average, foreclosure filings represent 25.6% of all sales in “H” block groups. Permitting activity in “H” markets (1.9%) is the third lowest of all market types. “H” markets typically have 51.4% homeowners and 48.6% renters; on average 13.0% of renter households receive public rental subsidy, the fifth lowest percentage among market types. The average vacancy rates in “H” markets (7.0%) are close to the average of the city.
- Market Type I: The typical home sales price in these “I” markets is $16,508, approximately 30% of the Richmond city average. Permitting activity in “I” markets is the second lowest in the city at 1.1%. “I” markets typically have 42.5% homeowners and of the 57.5% that are renters, 18.3% of those households are receiving some form of subsidy.
- Market Type J: “J” markets have the highest level of vacancy; approximately 1/5th of all residential land is either vacant buildings or vacant land. The typical home sales price in “J” markets is approximately $9,249, less than twelve times the city average, and foreclosure filings represent 15.8% of all sales. Permitting activity in “J” markets (0.7%) is the lowest rate in the city. This market has one-third of the population represented as owners (33.4%). Of the renter households, an average of 21.6% per block group are receiving public subsidy; the third highest level in the city.
Baltimore, MD (2014)
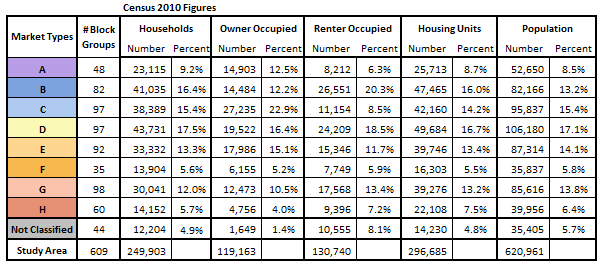
Reinvestment Fund’s Market Value Analysis (MVA) describes the characteristics of the block groups within a study area. In 2014, Reinvestment Fund updated the Market Value Analysis in Baltimore. Indicators are noted below and represent the dimensions upon which block groups are analyzed:
- Median Sales Price: City of Baltimore parcel dataset file of recorded sales between 2012 and 2014Q2 for residential sales of $1,000 or more. The median residential home sales price between, values under $1,000 were filtered out as non-arm’s length transactions. Residential sales were identified by usegroup in (‘R’,’M’,’U’) which is the “residential”, “apartment”, or “condo” designation, respectively.
- Coefficient of Variation: The coefficient of variation, derived from the City of Baltimore parcel dataset file of recorded sales, represents the variability of sale prices within the block group. (High numbers represent places with wide variations in sale prices.)
- Foreclosure as a Percent of Residential Parcels: Maryland is a non-judicial foreclosure state. Foreclosures from the City of Baltimore dataset, 2012-2014Q2, were divided by the count of residential parcels (from the City of Baltimore parcel dataset).
- Vacant Housing Parcels as a Percent of Residential Parcels:The count of vacant housing parcels, provided from the City of Baltimore as of September 2014, were divided by the count of residential parcels (from the City of Baltimore parcel dataset).
- Percent of Housing Units that are Owner Occupied: The count of housing units that are owner occupied, 2014, divided by the count of all occupied housing units (from the City of Baltimore parcel dataset).
- Building permits as a Percent of Residential Parcels: The count of parcels whose sum of building permits exceeds $10,000, 2012-2014Q2, divided by the count of total residential parcels (from the City of Baltimore parcel dataset). Permits during the time period are tagged to each parcel and then aggregated. Parcels which have a combined permit value greater than $10,000 are then included in this count.
- Commercial/Industrial land area as a Percent of Total Land Area: Commercial and industrial land area is calculated from the City of Baltimore parcel dataset, 2014.
- Vacant Residential Lots as a Percent of Residential Parcels: Count of residential parcels that are vacant land, November 2014, divided by the count of residential parcels (from the City of Baltimore parcel dataset). Areas with steep slope and with edges along the city boundary were removed.
- Percent Publicly Subsidized Rental: Count of Section 8 housing vouchers (from the City of Baltimore Housing office), divided by the count of renter occupied housing units (from the City of Baltimore parcel dataset).
- Housing Units per Square Mile: The count of housing units in 2014 (from the City of Baltimore parcel dataset) divided by the land area in square miles.
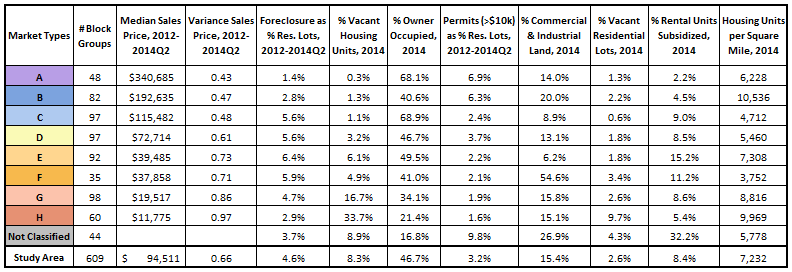
 The City of Baltimore uses Reinvestment Fund’s Market Value Analysis to create a Housing Market Typology, used by the Department of Housing, Housing Code Enforcement Division, and other stakeholders to strategically allocate public resources in alignment with neighborhood housing market conditions. The Housing Market Typology typically includes five categories, which correspond to eight distinct market types identified by Reinvestment Fund:
- Regional Choice – Type A: Block groups designated Regional Choice represent competitive housing markets with higher home prices and lower numbers of foreclosure filings relative to residential parcels (foreclosure rate). They have among the highest owner occupancy rate, highest level of permit activity, and lowest rate of vacant housing units.
- Middle Market Choice – Types B and C:
- Market Type C: : Block groups in the Middle Market Choice category have home prices above the city average. Type B has the second lowest foreclosure rate relative to sales volume, but twice the rate as Market A, as well as the second lowest coefficient of variance of sales price, second highest level of permit activity, highest density of housing units per square mile. Type C has lower rates of vacant housing units, higher rates of foreclosures (twice that of Market B), the highest owner occupancy rates, and lowest rates of vacant residential lots.
- Middle Market – Type D: Block groups in the Middle Market category have home prices close to the citywide average. These markets are defined by higher rates of foreclosures, below average rates of vacant housing and vacant lots, and permit activity close to the citywide average.
- Middle Market Stress – Types E and F: Block groups in Middle Market Stressed category have home prices less than half the citywide average. Type E is characterized by a percentage of publicly subsidized rental approximately twice the rate as D markets, the highest rate of foreclosures on average in the city, and lower levels of permit activity. Type F has higher foreclosure rates than the citywide average, below average vacant housing units. Type F has the second highest rates of vacant residential lots and the highest percent commercial/industrial land.
- Distressed – Types G and H Block groups in the Distressed Market category have experienced significant deterioration of the housing stock. Home prices in these markets are well below citywide average. Type G has an average number of foreclosures as a percent of parcels, the second highest level of vacant housing units, and the second lowest homeownership rate. Type H has the lowest rates of owner occupancy, highest rates of vacant housing and vacant lots, and lowest rates of permitting.
- Not Classified: All block groups that had fewer than 5 sales in 2012-2014Q2; these block groups tend to be either entirely rental housing or non-residential uses.
Baltimore, MD (2011)
In 2011, Reinvestment Fund updated the Baltimore Market Value Analysis for the City of Baltimore.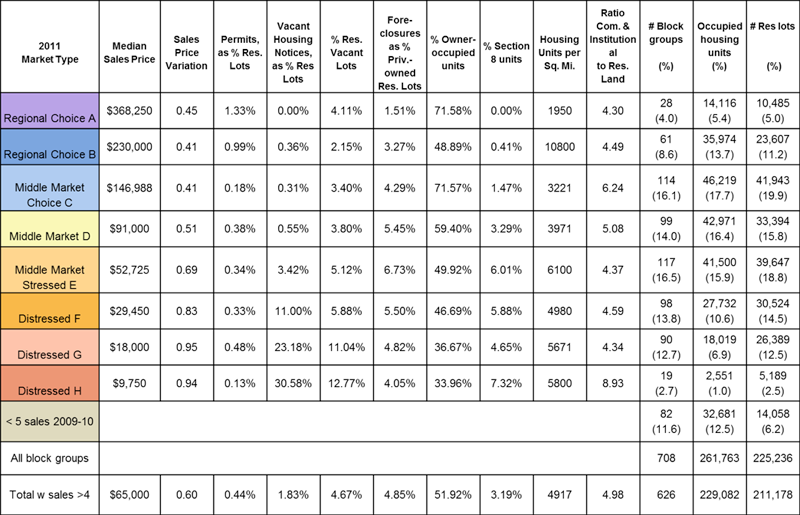 The City of Baltimore used Reinvestment Fund’s Market Value Analysis to create a Housing Market Typology, used by the Department of Housing, Housing Code Enforcement Division, and other stakeholders to strategically allocate public resources in alignment with neighborhood housing market conditions. The Housing Market Typology includes five categories, which correspond to eight distinct market types identified by Reinvestment Fund: Regional Choice (A and B), Middle Market Choice (C), Middle Market (D), Middle Market Stressed (E), and Distressed (F, G, and H).
- Regional Choice – Types A and B: Block groups designated Regional Choice represent competitive housing markets with high owner-occupancy rates and property values in comparison to all other market types. Foreclosure, vacancy and abandonment rates are low. Substantial market interventions are not necessary in the Regional Choice category. Basic municipal services such as street maintenance are essential to maintaining these markets.
- Middle Market Choice – Type C: Block groups in the Middle Market Choice category have housing prices above the city’s average with strong ownership rates, and low vacancies. However, these areas show slightly increased foreclosure rates. Modest incentives and strong neighborhood marketing should be used to keep these communities healthy, with the potential for growth.
- Middle Market – Type D: Block groups in the Middle Market category have median sale values of $91,000 (above the City’s average of $65,000) as well as high homeownership rates. These markets experienced higher foreclosure rates when compared to more competitive markets, with slight population loss. Neighborhood stabilization and aggressive marketing of vacant houses should be considered in this category. Diligent housing code enforcement is also essential to maintain the existing housing stock.
- Middle Market Stressed – Type E: Block groups in the Middle Market Stressed category have slightly lower home sale values than the City’s average, and have not shown significant sale price appreciation. Vacancies and foreclosure rates are high, and the rate of population loss has increased in this market type, according to the 2010 Census data. Based on these market conditions, intervention strategies should support homeowners who may be facing economic hardships due to adverse changes in the national economy.
- Distressed – Types F, G, and H: Block groups in the Distressed Market category have experienced significant deterioration of the housing stock. This market category contains the highest vacancy rates and the lowest homeownership rates, compared to the other market types. Block groups in this category have also experienced the most substantial population losses in the City during the past decade. Comprehensive housing market inventions should be targeted in this market category, including site assembly, tax increment financing, and concentrated demolitions to create potential for greater public safety and new green amenities.
Baltimore, MD (2008)
In 2008 Reinvestment Fund updated the Baltimore Market Value Analysis with the Baltimore City Planning Department and Baltimore Housing.Reinvestment Fund cluster analysis revealed nine market types, characterized as follows:
- Competitive: Neighborhoods in this category, like Federal Hill, Canton, and Homeland, have robust housing markets with high owner-occupancy rates and high property values. Foreclosure, vacancy, and abandonment rates are all very low. Most direct interventions are not necessary in the Competitive market. Basic municipal services such as street maintenance are essential to maintaining these markets. While densities do vary, single family detached homes predominate and these areas typically don’t have a mix of housing types.
- Emerging: neighborhoods in the “Emerging” category, such as Abell, Hampden and Mt. Vernon, have robust housing markets but with homeownership rates slightly below the citywide average; this category appeals to property owners interested in tapping into a strong rental market. Median sales price is above $244,000. Additional incentives for development and investment in the Emerging market would recognize its potential for growth. There is more variety in housing types and more commercial areas than in the competitive cluster.
- Stable: This cluster includes neighborhoods such as Reservoir Hill, Lauraville and Violetville. Median sale price is around $160,000 and the rate of foreclosure is just below the City average of 5%. In Stable markets, the City should consider stabilizing and marketing any vacant houses. Traditional housing code enforcement is also essential to maintain the existing housing stock. Homeownership is still significant at 55%.
- Transitional: Neighborhoods in the “Transitional” category, such as Allendale, Belair Edison and Kenilworth Park, are found typically at the inner edge of the stable neighborhoods. These neighborhoods have moderate real estate values with median sales prices between $80,000-$100,000, with higher median sales in areas with commercial land uses. Foreclosure rates are slightly higher than average, but occupancy rates are still higher than average. This cluster also has the highest rate of rental subsidy. The city should support homeowners who may be facing economic hardships due to the national economy.
- Distressed: These neighborhoods, which include Middle East, North Penn and Westport, have nearly four times the level of vacant homes and vacant lots as found in other categories. Sale prices typically range from $36,000-$40,000. Distressed markets tend to rely on comprehensive housing market interventions, such as site assembly and tax increment financing. One of the six criteria for identifying the Growth Promotion Areas includes neighborhoods located in distressed markets. Demolitions in the Distressed markets should be clustered to create potential for greater public safety and well as marketability. The housing type here is predominantly rowhouse.
Baltimore, MD (2005)
In 2005 Reinvestment Fund developed a Market Value Analysis for the City of Baltimore Planning Department.Reinvestment Fund cluster analysis revealed seven market types, characterized as follows:
- Competitive: high owner occupancy, high property values, and low abandonment.
- Emerging: fairly high homeownership rates, relatively low foreclosure rate, variety in housing type and greater number of commercial properties.
- Stable: slightly above average foreclosure rate, high homeownership rate, relatively new housing stock.
- Transitional: moderate average sales price, high homeownership rate, and very high foreclosure rate.
- Distressed: very high vacancy rate, very high percentage of vacant lots, low homeownership rate and lowest average sales price.
MISSOURI
Kansas City, MO
Reinvestment Fund’s Market Value Analysis (MVA) describes the characteristics of the block groups within a study area. The MVA indicators in Kansas City are noted below and represent the dimensions upon which block groups are analyzed:
- Median Home Values: The median value of all residential home sales occurring between 2014 and 2016q2, excluding homes purchased by a Land Bank authority or purchased for values below $1,000 or above $3,000,000. Data source for this indicator is RealQuest.
- Variance of Sales Price: The coefficient of variance of residential home sales occurring between 2014 and 2016q2. Excludes homes purchased by a Land Bank authority or purchased for values below $1,000 or above $3,000,000. Calculation for this indicator is (Average Value ÷ Standard Deviation). Data source for this indicator is RealQuest.
- Share of Homes with Permits $1k+ or New Construction: The share of residential properties with non-demolition permits valued more than $1,000 issued between 2014 and 2015. Data source for this indicator is the City of Kansas City, MO.
- Distressed Sales as a Share of Sales: Share of residential property sales between 2014 and 2016q2 where the seller or owner was a bank or the sale type was flagged as a non-standard transaction (e.g. “Sheriffs Sale”, “Tax Deed”, “Foreclosure Deed”). Data source for this indicator is RealQuest.
- Share of Homes with Maintenance Violations: The share of residential properties that were issued a maintenance-related violation between 2014 and 2015. The data source for this indicator is the City of Kansas City, MO.
- Vacant Properties as a Share of Residential Properties: The share of residential properties that were owned by a bank, cited on the city’s dangerous buildings list, cited for vacancy, listed in the city’s vacancy property registry, or requested a permit for demolition between 2014 and 2015. The data source for this indicator is the City of Kansas City, MO.
- Density of Housing Units: Number of households per acre of land. Equals count of owner and renter occupied households divided by acres of residential land. The data source for this indicator is the City of Kansas City, MO.
- Percent Owner Occupied Households: Percent of households that reported owning their home. Data source for this indicator is the U.S. Census Bureau’s American Community Survey 2010-2014.
- Share of Rentals in Single Family Homes: Share of households renting their home in a building with one to four units. Data source for this indicator is the U.S. Census Bureau’s American Community Survey 2010-2014.
- Share of Households with Subsidy (Excluding Senior Housing): Number of subsidized units that were not exclusively for seniors as a share of all households. Data source for this indicator is HUD’s Picture of Subsidized Housing.
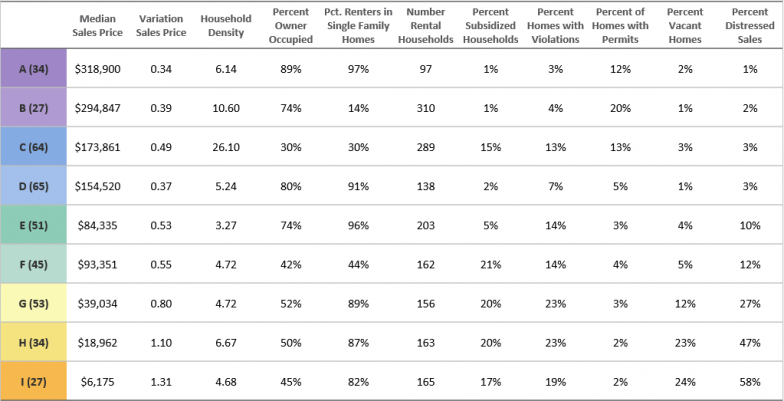
 Reinvestment Fund’s cluster analysis revealed nine market types (A, B, C, D, E, F, G, H, I). These markets are described below.
- Market Type A: Highest value homes in the city, lower density than market type B, lowest rate of subsidized households along with market type B, lowest share of homes with maintenance violations and distressed sales.
- Market Type B: High value homes, more multifamily buildings than A markets, low percentage of subsidized households and vacant homes, more investment activity (i.e. building permits) than market type A.
- Market Type C: Moderate value homes, highest household density of all markets in the city, largely renter occupied households, higher share of subsidized households and maintenance violations than market type D but also more investment activity (i.e. building permits).
- Market Type D: Moderate value homes but slightly lower than C markets, largely owner occupied households, low share of subsidized households, homes with maintenance violations, vacant homes and distressed sales but also a small percentage of homes with building permits indicating lower level of investment than market type C.
- Market Type E: Moderate value homes, but median sales price almost half that of C and D markets. Lowest household density in the city, largely owner occupied homes. Shares of homes with maintenance violations and distressed sales higher than market types C/D.
- Market Type F: Moderate value homes, but median sales price almost half that of C and D markets. More subsidized rental households and distressed sales than E markets.
- Market Type G: Low value homes, owner occupied versus renter occupied households pretty evenly split, high share of subsidized households, homes with violations and distressed sales. Share of vacant homes more than double that of market type F.
- Market Type H: Low value homes, median sale price less than half that of market type G. Distressed sales account for almost half of all home sales, high vacancy rate and high percentage of violations.
- Market Type I: Lowest value homes in the city, highest vacancy rate in the city, distressed sales account for more than half of all homes sales.
- Non Residential: Non residential areas of the city where there were fewer than 100 housing units in a given block group.
- Insufficient Data: All block groups that had fewer than 5 residential sales; these block groups tend to be either entirely rental housing or non-residential uses.
NEW JERSEY
Asbury Park, NJ (2022)
Reinvestment Fund’s Market Value Analysis (MVA) describes the characteristics of the block groups within a study area. In 2023, Reinvestment Fund updated the Market Value Analysis in Asbury Park, New Jersey.The MVA indicators in Asbury Park are noted below and represent the dimensions upon which block groups are analyzed:
- Median Sales Price, 2019 – 2021: Median price of arms-length residential property transactions between 2019 and 2021 Q2
- Coefficient of Variance: Dispersion of prices within census block groups over the target time period
- Rate of Housing Renovation: Share of homes with permits for substantial residential renovation valued over $5k
- Rate of Distressed Residential Sales: Share of property transactions classified as foreclosure, sheriff sale, or bank purchase
- Rate of Residential Vacancy: Share of vacant residential addresses.
- Rate of Investor Purchases: Share of home sales where purchaser was an investor or institutional owner
- Rate of Homeownership: Share of owner occupied households
- Share of Subsidized Renters: Share of rent subsidized housing units excluding units in senior developments
- Housing Density: Ratio of households to residential parcels
The tables below show each component’s average for each MVA category.
Reinvestment Fund cluster analysis revealed nine market types, characterized as follows:
- Market Type A: Asbury Park area’s most expensive housing market with twice as high median home sales price than the regional average. The housing stock shows many strengths, such as the high rate of housing renovation and permitting activities, high homeowner occupancy, low vacancy rates, and few distressed home sales. These neighborhoods are the least dense in the area, with predominantly large single-family houses with spacious front yards.
- Market Type B: Strong renters’ markets that consist of a mix of single-family homes and multi-family housing of various sizes. These markets have the highest housing renovation and permitting rates in the study area.
- Market Type C: Makes up the area’s middle markets with the “D” markets. Median home sales prices are much more affordable than the “A” and “B” markets. These markets have the highest owner-occupancy rate in the study area, and the home prices within the block groups are most consistent. As the lower rate of permitting activities indicates, neighborhoods’ housing stock shows minor signs of deferred maintenance.
- Market Type D: Similar median home sales price with the “C” market, but the homes are predominately occupied by renters. These neighborhoods have the highest vacancy rate relative to the rest of the region.
- Market E: The most affordable housing markets in the area, but the median sales price is nearly $250,000, and investors make up close to half of the home buyers. The homes are mainly renter-occupied, and many of them receive a rental subsidy.
Atlantic Highlands, NJ (2007)
In 2007 Reinvestment Fund developed a Market Value Analysis of the Atlantic Highlands for the New Jersey Department of Community Affairs.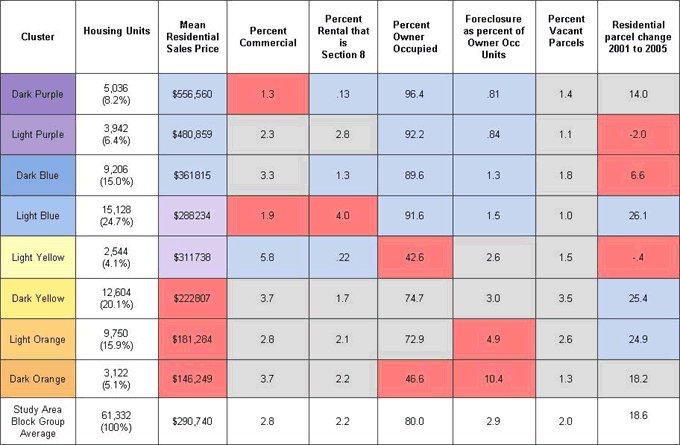
Reinvestment Fund cluster analysis revealed eight market types, characterized as follows:
- Dark Purple: highest average sales price, fairly high percent commercial, highest percent owner occupied.
- Light Purple: relatively high percent owner occupied and relatively low percent foreclosure.
- Dark Blue: fairly high average sales price, fairly low percent of rental that is Section 8.
- Light Blue: highest residential parcel change rate, relatively high percent owner occupied, highest percent of rental that is Section 8.
- Light Yellow: fairly high average sales price, very low percent owner occupied.
- Dark Yellow: very high residential parcel change rate, fairly low percent of rental that is Section 8.
- Light Orange: fairly low average sales price, fairly high percent foreclosure.
- Dark Orange: very low percent owner occupied, very high percent foreclosure.
Camden, NJ (2022)
Reinvestment Fund’s Market Value Analysis (MVA) describes the characteristics of the block groups within a study area. In 2023, Reinvestment Fund updated the Market Value Analysis in Camden, New Jersey.The MVA indicators in Camden are noted below and represent the dimensions upon which block groups are analyzed:
- Median Sales Price, 2019 – 2021: Median price of arms-length residential property transactions between 2019 and 2021 Q2
- Coefficient of Variance: Dispersion of prices within census block groups over the target time period
- Rate of Homeownership: Share of owner occupied households
- Rate of Housing Renovation: Share of homes with permits for residential renovation
- Rate of Distressed Residential Sales: Share of property transactions classified as foreclosure, sheriff sale, or bank purchase
- Rate of Vacant Residential Parcels: Share of vacant housing units
- Share of Subsidized Renters: Share of rent subsidized housing units excluding units in senior developments
- Rate of Residential Land Use: Proportion of land area in parcels with residential land uses
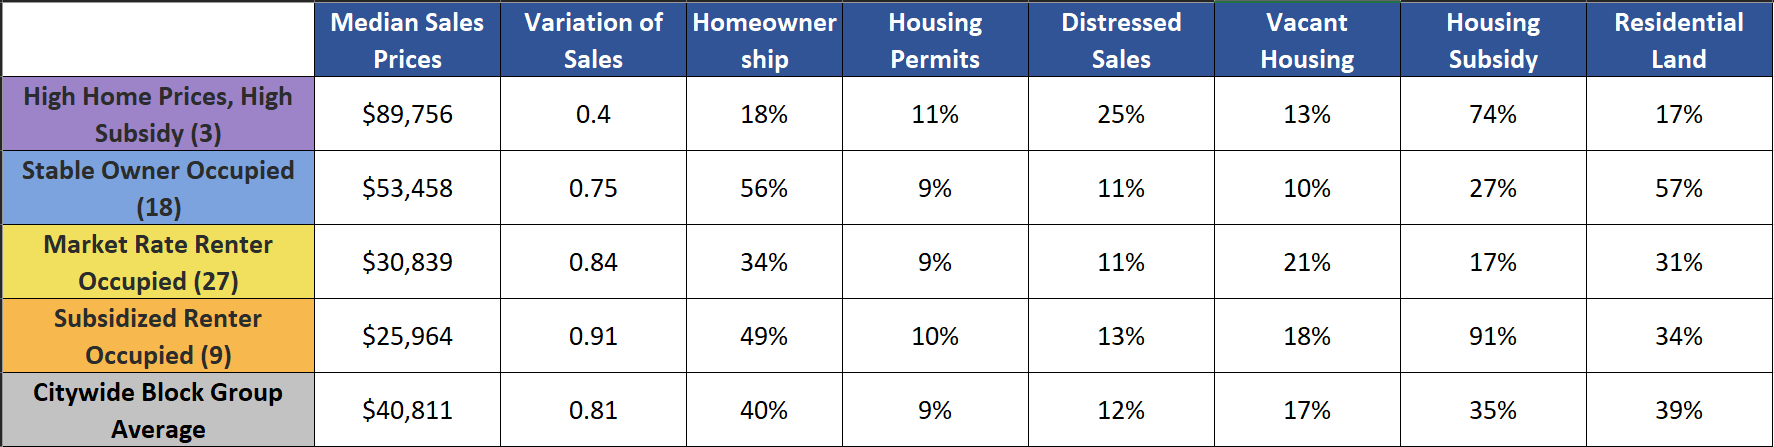
- High Home Prices, High Subsidy: Camden’s most expensive block groups are areas where the housing market is supported by public or private investment.
- Stable Owner Occupied: These markets are largely residential, mostly owner-occupied, and have vacancy rates below the city average.
- Market Rate Renter Occupied: Neighborhoods in this market type are mostly renter-occupied and have the lowest share of renters receiving housing subsidy.
- Subsidized Renter Occupied: Home prices are very low, and residents are split nearly evenly between renters and owners; over 90% of renters are using subsidy of some kind. Most land is designated for use other than residential.
Camden, NJ (2000)
In 2000 Reinvestment Fund developed a Market Value Analysis of Camden for the New Jersey Department of Community Affairs. Reinvestment Fund cluster analysis revealed six market types, as follows:
- High Value: highest average sales price at $116,864, very low vacancy rate, majority owner-occupied, and the lowest number of Section 8 certificates.
- Strong Value: high average sales price, high rate of homeownership, low number of Section 8 certificates, lowest number of demolition permits per capita, and lowest vacancy rate at 0.3%.
- Steady: highest rate of homeownership at 79%, highest number of alteration and addition permits per capita, lowest number of older homes, and average number of vacancies.
- Transitional: fairly low average residential sales price, above average owner-occupied.
- Distressed Public Market: highest number of Section 8 certificates and low average home sales price.
- Reclamation: highest number of older homes, lowest average sales price at $18,063, highest vacancy rate at 16.9%, lowest home ownership rate at 44.5%, and highest number of those with high or very high risk credit.
Meadowlands, NJ (2007)
In 2007 Reinvestment Fund developed a Market Value Analysis of the Meadowlands for the New Jersey Department of Community Affairs.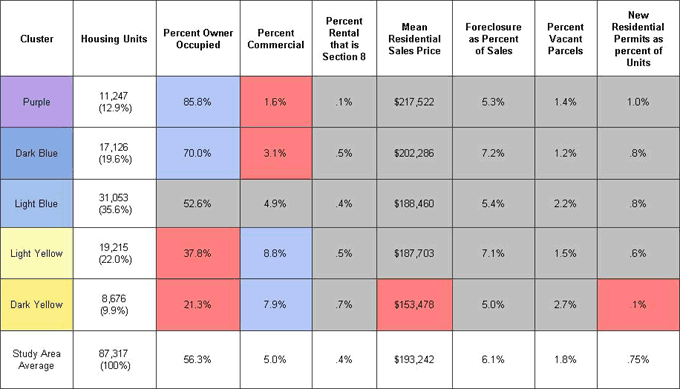
Reinvestment Fund cluster analysis revealed five market types, characterized as follows:
- Purple: highest owner occupancy, lowest percent commercial, higher average sale price, highest percent of residential permits.
- Dark Blue: high owner occupancy, low percent commercial, slightly higher average sale price, foreclosures evident.
- Light Blue: average sales price, 52% owner occupied, evident vacant parcels.
- Light Yellow: low owner occupancy, highest percent commercial, average sales price, foreclosure activity.
- Dark Yellow: lowest owner occupancy, high percent commercial, lowest average sales price, lowest percent of residential permits.
Newark, NJ (2022)
Reinvestment Fund’s Market Value Analysis (MVA) describes the characteristics of the block groups within a study area. In 2023, Reinvestment Fund updated the Market Value Analysis in Newark, New Jersey.The MVA indicators in Newark are noted below and represent the dimensions upon which block groups are analyzed:
- Median Sales Price, 2018 – 2020: Median price of arms-length residential property transactions between 2018 and 2020 Q2
- Coefficient of Variance: Dispersion of prices within census block groups between 2018 and 2020 Q2
- Rate of Homeownership: Share of owner occupied households
- Share of Investor Purchases: Share of home sales where purchaser was an investor or institutional buyer
- Share of Housing Renovation: Share of homes with permits for substantial residential renovation valued over $4k
- Share of Code Violations: Share of residential properties with 10 or more health and safety or maintenance code violations
- Share of Vacant Residential Parcels: Share of residential properties listed on city’s abandoned property list, had vacancy related code violations between 2019 – 2021, or was classified as a city-owned tax-lien foreclosure
- Share of Distressed Residential Sales: Property transactions between 2018 – 2020 Q2 classified as foreclosure, sheriff sale, or bank purchase as a share of households
- Share of Subsidized Renters: Share of rent subsidized housing units
- Housing Density: Residential acre per housing units
- Market Type A: Mainly characterized by high residential property sales, low investor ownership rates, and very little vacancy and property maintenance issues (i.e., code violations). Density can vary between different “A” markets. In particular, the eastern “A” markets (including the Ironbound neighborhood) had much greater density than other northern “A” market neighborhoods.
- Market Type B: These markets have affordable home prices and a stock of larger, well-maintained homes. These markets consist of larger single-family homes that have been converted into multi-family properties. The distinction between single and multi-family properties in this market is often difficult to distinguish.
- Market Type C: These markets have affordable home prices and a stock of larger well-maintained homes. “C” markets are less dense, with most homes still operating as single-family residences. These markets had the highest rate of homeownership in the city.
- Market Type D: These markets have the highest concentration of subsidized housing units and the highest housing vacancy rates in the city. These markets have the city’s densest housing stock, comprised mainly of larger multi-family developments and apartment buildings.
- Market Type E: Home prices are very low in these markets. The homeownership rate is also very low, which goes hand in hand with the high rate of investor buyers. Homes are close together and consist of many subsidized properties.
- Market Type F: “F” Markets were the most distressed markets in Newark. These areas had among the city’s lowest home prices and highest vacancy rates. Code violations were common, reflecting a substantial level of deferred property maintenance. Investor activity was common with most home sales transacting with investor involvement.
Newark, NJ (2007)
In 2007 Reinvestment Fund developed a Market Value Analysis of Newark for the New Jersey Department of Community Affairs.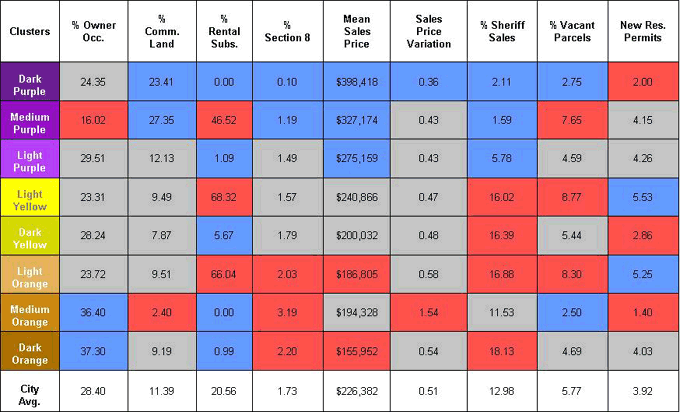
- Dark Purple: no subsidized rental units and highest mean sales price.
- Medium Purple: lowest percent owner occupied at 16%, highest percent commercial land, and lowest percent sheriff sales.
- Light Purple: very low percent subsidized rental and relatively high mean residential sales price.
- Light Yellow: highest percent subsidized rental at 68%, highest percent of vacant parcels, and highest rate of new residential construction.
- Dark Yellow: low percent subsidized rental and high percent sheriff sales.
- Light Orange: very high percent subsidized rental, low mean residential sales price and very high percent vacant.
- Medium Orange: high percent owner occupied, lowest percent commercial land at 2%, no subsidized rental units, and high rate of sales price variation.
- Dark Orange: highest percent owner occupied, lowest mean residential sales price, and highest percent sheriff sales at 18%.
The Oranges, NJ (2007)
In 2007 Reinvestment Fund developed a Market Value Analysis of the Oranges for the New Jersey Department of Community Affairs.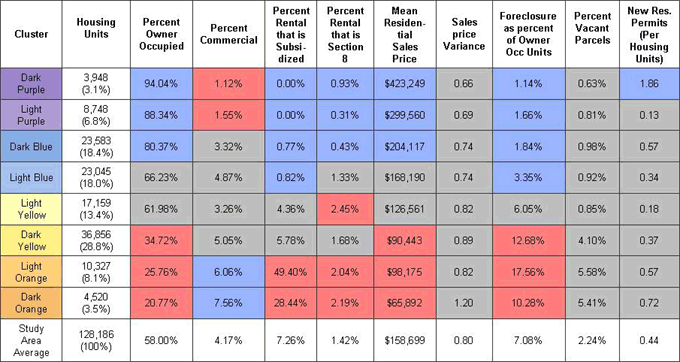
Reinvestment Fund cluster analysis revealed eight market types, characterized as follows:
- Dark Purple: highest owner occupancy, no subsidized rental housing, highest average sales price, lowest foreclosure rate, lowest percent commercial, highest rate of new residential permits.
- Light Purple: high owner occupancy, low percent commercial, no subsidized rental housing, low foreclosures.
- Dark Blue: high owner occupancy, relatively high home prices, relatively low foreclosure rate.
- Light Blue: average owner occupancy, low subsidized housing, average residential prices, relatively low foreclosure rate.
- Dark Yellow: Low owner occupancy, low average sales price, high foreclosure rate.
- Light Yellow: average owner occupancy, very high percent Section 8.
- Dark Orange: lowest owner occupancy, lowest average sales price, high foreclosure rate, high rate of subsidized housing high rate of vacancy.
- Light Orange: Highest rate of subsidized housing, highest rate of foreclosure, highest rate of vacancy.
Riverline, NJ (2007)
In 2007 Reinvestment Fund developed a Market Value Analysis of the Riverline (along the light rail line extending from Trenton to Camden) for the New Jersey Department of Community Affairs.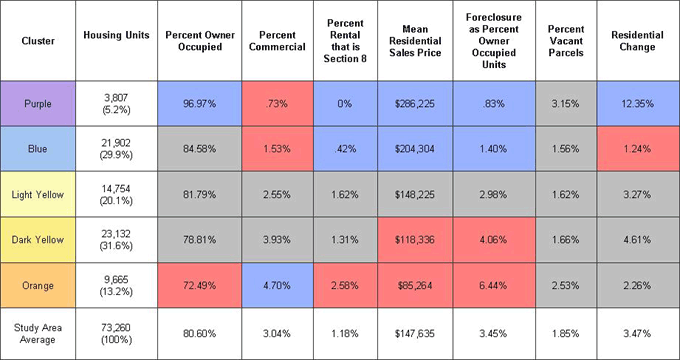 />
/>Reinvestment Fund cluster analysis revealed five market types, characterized as follows:
- Purple: highest owner occupancy, lowest percent commercial, no Section 8 housing, highest average sales price, lowest foreclosure rate, greatest residential change.
- Blue: relatively low percent commercial mix, very low Section 8 rental housing, relatively strong average residential sales price, very low foreclosure rate and very low residential change.
- Dark Yellow: low average sales price, relatively high foreclosure rate, some commercial.
- Light Yellow: average percent commercial, average foreclosure rate, average sale prices.
- Orange: very low percent owner occupied, comparatively high percent commercial, very low average sales price, and very high foreclosure rate.
Southern Passaic County, NJ (2022)
Reinvestment Fund’s Market Value Analysis (MVA) describes the characteristics of the block groups within a study area. In 2023, Reinvestment Fund updated the Market Value Analysis in Paterson and Southern Passaic County, New Jersey.The MVA indicators in Paterson and Southern Passaic County are noted below and represent the dimensions upon which block groups are analyzed::
- Median Sales Price, 2019 – 2021: Median price of arms-length residential property transactions between 2019 and 2021 Q2
- Coefficient of Variance: Dispersion of prices within census block groups over the target time period
- Rate of Homeownership: Share of owner occupied households
- Rate of Housing Renovation: Share of homes with permits for substantial residential renovation valued over $4k
- Rate of Distressed Residential Sales: Share of property transactions classified as foreclosure, sheriff sale, or bank purchase
- Rate of Vacant Residential Parcels: Share of vacant residential parcels (houses and lots)
- Share of Subsidized Renters: Share of rent subsidized housing units excluding units in senior developments
- Rate of Investor Purchases: Share of home sales where purchaser was an investor or institutional owner
- Rate of Residential Land Use: Proportion of land area in parcels with residential land uses
- Market Type A: Most expensive housing market with the highest rate of housing renovation and permitting. Predominantly owner-occupied, with little investor activity and minimal vacancy. Single-family homes predominated with larger lots and wide front yards.
- Market Type B: Mix of owner- and renter-occupied housing. Many homes are single-family properties that have been subdivided. While most properties have minimal deferred maintenance, there is generally less visible investment in home exteriors and landscaping.
- Market Type C: Mix of owner- and renter-occupied housing. Many homes were built as multi-family properties and while there is minimal deferred maintenance, there is generally less investment in landscaping and property exteriors. These markets contain a mix of commercial and residential land uses.
- Market Type D: These markets have the most visible deferred maintenance and vacancy. Most homes are renter-occupied and there are high levels of investor activity, with minimal permitting for new construction or renovation.
- Market Type E: Orange markets have the highest concentration of subsidized housing and properties with deferred maintenance and vacancy. Most homes are renter-occupied and there are high levels of investor activity, with minimal permitting for new construction or renovation.
Vineland, NJ (2007)
In 2007 Reinvestment Fund developed a Market Value Analysis of the Vineland area (including Millville and Bridgeton) for the New Jersey Department of Community Affairs.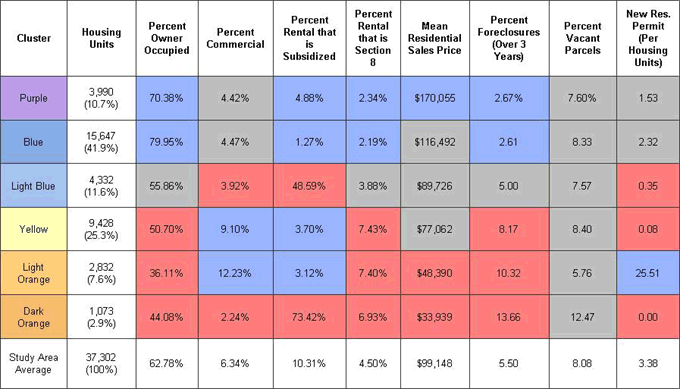
Reinvestment Fund cluster analysis revealed six market types, characterized as follows:
- Purple: highest average sales price, high owner occupancy, and low presence of subsidized housing, lower vacancy.
- Blue: highest owner occupancy, slightly higher than average sale prices, lowest percent subsidized housing, lowest percent of foreclosures.
- Light Blue: below average sale prices, very high percentage of subsidized rental units, low rate of new residential construction.
- Yellow: below average sale prices, low owner occupancy, high level of commercial, high percent Section 8 rentals.
- Light Orange: lowest owner occupancy, highest percent commercial, highest percent of Section 8 rentals, and very high rate of new residential construction.
- Dark Orange: lowest average sales price at $33,930, lowest percent commercial, highest percent of foreclosures, highest percent of subsidized rental units.
Washington Township, NJ (2007)
In 2007 Reinvestment Fund developed a Market Value Analysis of the Washington Township area for the New Jersey Department of Community Affairs.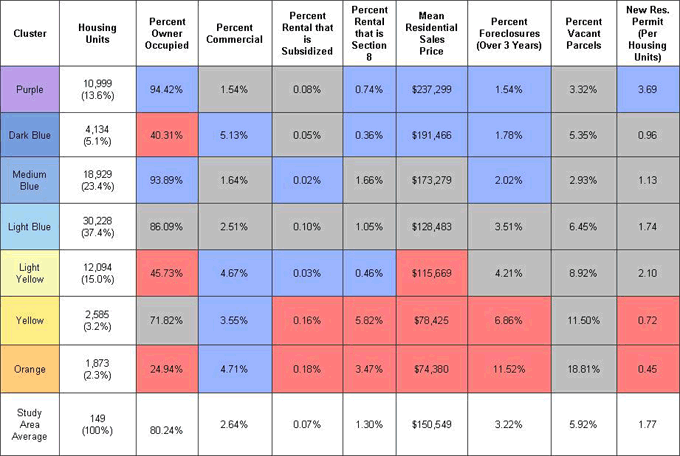
Reinvestment Fund cluster analysis revealed seven market types, characterized as follows:
- Purple: highest owner occupancy, very low percent Section 8 rental, highest residential sales price, lowest foreclosure rate, highest rate of new residential construction.
- Dark Blue: very low owner occupancy, highest percent commercial, lowest percent Section 8 rental, and relatively high sale prices.
- Medium Blue: very high owner occupancy, lowest percent of subsidized rental, low foreclosure rate.
- Light Blue: average percent commercial, average foreclosure rate, lower than average sale prices.
- Light Yellow: low owner occupancy, high percent commercial, lower than average sale prices, very low rate of new residential construction.
- Yellow: highest percent of Section 8 rentals, very low mean residential sales price, and relatively high percent commercial.
- Orange: lowest owner occupancy, lowest average residential sales price, highest percent of foreclosures, lowest rate of new residential construction.
PENNSYLVANIA
Allegheny County, PA (2016)
Reinvestment Fund’s Market Value Analysis (MVA) describes the characteristics of the block groups within a study area. The MVA indicators in the 2016 MVA for Allegheny County are noted below and represent the dimensions upon which block groups are analyzed:
- Median Sale Price: Median residential real estate sale price for sales of $1,000 or more from 2013 through 2015. Median sales price has been calculated both with and without condominiums; the model uses the higher of the two for all block groups. The data source is the Allegheny County Office of Property Assessments (courtesy of the Western Pennsylvania Regional Data Center).
- Coefficient of Variation of Sales Price: The coefficient of variation describes the variability of sale prices within the block group. The coefficient of variation is calculated by dividing the standard deviation of sale prices by the mean. The data source is the Allegheny County Office of Property Assessments (courtesy of the Western Pennsylvania Regional Data Center).
- Percent Mortgage Foreclosure: Foreclosure filings from 2013 through 2015 as a percentage of owner occupied households. The data source is the Allegheny County Department of Court Records.
- Residential Vacancy: Residential vacancy is the percentage of residential addresses where mail has not been collected for at least 90 days. The residential vacancy indicator was calculated as a four quarter average from the second quarter of 2015 through the first quarter of 2016. The data source is Valassis Lists.
- Percent of Parcels Built 2008 or Later: New construction activity was measured by calculating the percent of residential parcels with a building constructed in 2008 or later as a percentage of all residential parcels. The data source is the Allegheny County Office of Property Assessments’ assessment file (downloaded from the Western Pennsylvania Regional Data Center in January, 2016).
- Percent of Parcels in “Poor” or Worse Condition: The Allegheny County Office of Property Assessments rates the condition of buildings on each parcel in Allegheny County from “Excellent” to “Unsound”. Concentrations of blight were measured by calculating the number of residential parcels in “Poor”, “Very Poor”, or “Unsound” condition divided by all residential parcels. The data source is the Allegheny County Office of Property Assessments (downloaded from the Western Pennsylvania Regional Data Center in January, 2016).
- Percent Owner Occupied: The percent of owner occupied households. The data source is the 2010 – 2014 American Community Survey.
- Percent Subsidized Rental Units: Subsidized rental units are measured as the sum of units in public housing developments and multi-family assistance properties and the sum of housing choice vouchers divided by the number of rental units. The data source is the Allegheny County Housing Authority.
The table below shows each component’s average for each MVA category.
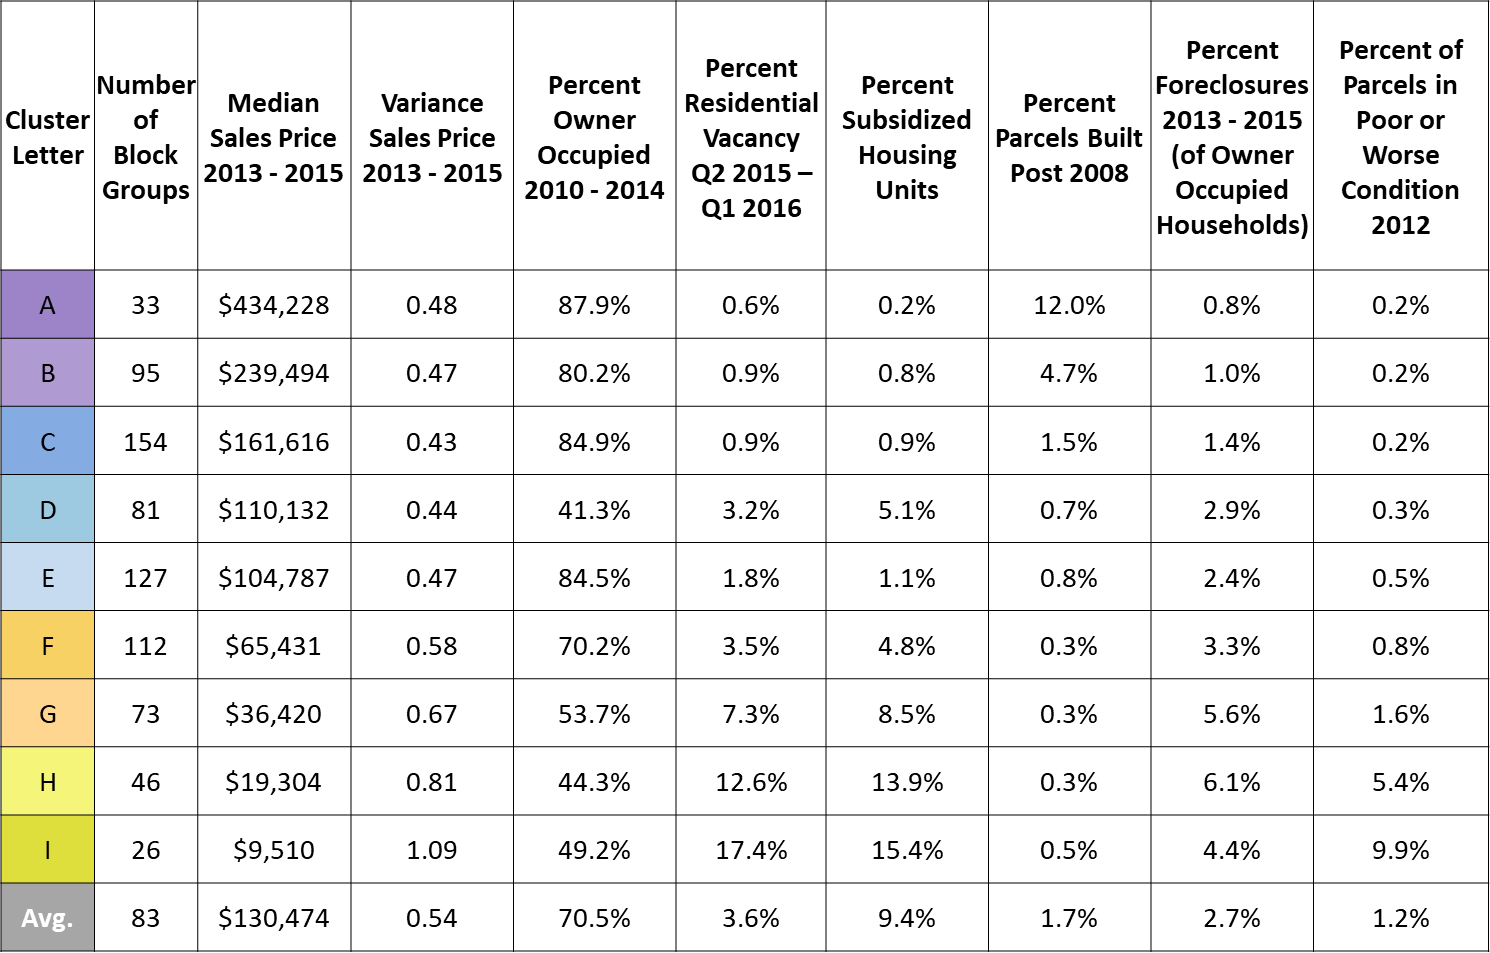
Reinvestment Fund’s cluster analysis revealed nine market types, characterized as follows:
- Robust “A”: Highest home values, largest level of new construction, highest owner occupancy levels, and little housing distress (such as residential vacancy and foreclosure).
- Robust “B”: Elevated home values, substantial amounts of new construction, high levels of owner occupancy, and little housing distress.
- Steady “C”: Above average home values, about average levels of new construction, high levels of owner occupancy, and little housing distress.
- Steady “D”: Slightly below average home values, half the countywide average amount of new construction, more renters than owners, and about average levels of foreclosure and residential vacancy.
- Steady “E”: Slightly lower than average home values, half the countywide average amount of new construction, high levels of owner occupancy, low levels of residential vacancy, about average levels of foreclosure.
- Transitional “F”: Home values about half the countywide average, little new construction, more owners than renters, and about average levels of foreclosure and residential vacancy.
- Transitional “G”: Below average home values, little new construction, slightly more owners than renters, and about twice the countywide average levels of foreclosure and residential vacancy.
- Distressed “H”: Home values well below the countywide average, little new construction, more renters than owners, elevated levels of residential vacancy, and the highest levels of foreclosure in the County.
- Distressed “I”: Lowest home values in Allegheny County, little new construction, about an even share of owners and renters, the highest levels of residential vacancy, and elevated levels of foreclosure.
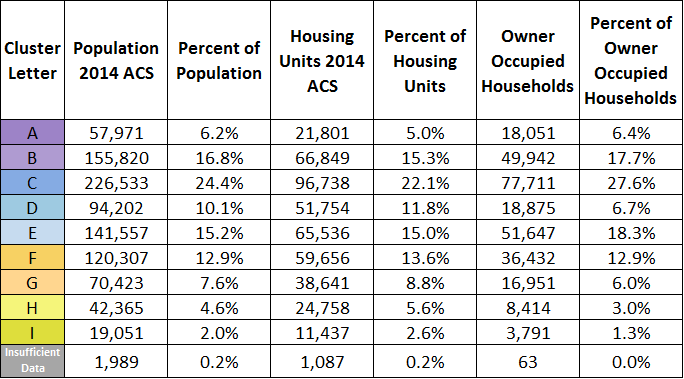
Bethlehem, PA (2017)
Reinvestment Fund’s Market Value Analysis is a unique tool for characterizing markets as it creates an internally referenced index of a municipality’s residential real estate market. In 2017, the first Market Value Analysis was developed for Bethlehem, PA. Below are the indicators used in the 2017 Bethlehem MVA:
- Median Sales Price: Median sales price of sales transactions that occurred between 2015 and 2017Q2. Data sources for this indicator were Lehigh and Northampton Counties.
- Variance of Sales Price: The coefficient of variance of sales price for sales transactions that occurred between 2015 and 2017Q2. Data sources for this indicator were Lehigh and Northampton Counties.
- Two-to-Four Family Sales: The share of sales transactions that were for two-to-four family properties, sold between 2015 and 2017Q2. Data sources for this indicator were Lehigh and Northampton Counties.
- Condo Sales: The share of sales transactions that were condos, sold between 2015 and 2017Q2. Data sources for this indicator were Lehigh and Northampton Counties.
- Owner Occupancy: The share of households that reported owning their home. Data source for this indicator was American Community Survey, 2011-2015.
- Subsidized Housing: The share of rental units with subsidies. Data sources for this indicator were City of Bethlehem, US Department of Housing and Urban Development, and American Community Survey, 2011-2015.
- Housing Density: Residential housing units per residential land area. Data sources for this indicator were Lehigh and Northampton Counties and American Community Survey, 2011-2015.
- Investor Purchases: The share of sales transactions that were sold to investors, sold between 2015 and 2017Q2. Data source for this indicator was Lehigh and Northampton Counties.
- Multiple Permits: The share of residential parcels with at least two permits between 2015 and 2017 (July). Data source for this indicator was the City of Bethlehem.
- New Construction Permits: The share of residential parcels with new construction building permits between 2011 and 2017 (July). Data source for this indicator was City of Bethlehem.
- Distressed Properties: The share of residential parcels that were registered in Pro Champs between 2015 and 2017 (Oct.), registered in Pro Champs prior to 2015 but the status remains open, or received an Act 91 Notice between 2015 and 2017Q2. Data source for this indicator was the City of Bethlehem, Pennsylvania Housing Finance Agency, and Lehigh and Northampton Counties.
- Multiple Violations: The share of residential parcels with a violation that had at least five violation citations between 2015 and 2017 (July). Data source for this indicator was the City of Bethlehem.
- Blight: The share of residential parcels that experienced a water shutoff and/or were identified in the Blight Survey. Data source for this indicator was the City of Bethlehem.
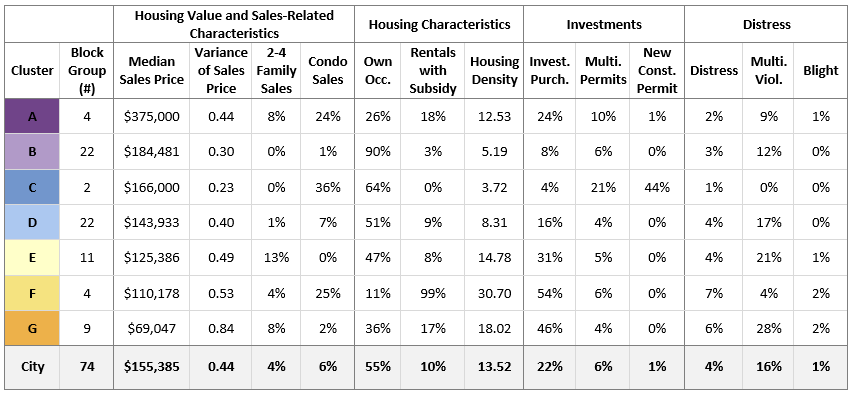 The 2017 Bethlehem Market Value Analysis identified seven distinct market types, from A to G. Below are brief descriptions of each market type:
Strong Markets
The 2017 Bethlehem Market Value Analysis identified seven distinct market types, from A to G. Below are brief descriptions of each market type:
Strong Markets
- A Markets are the strongest markets in Bethlehem and are largely characterized by high sales prices, low levels of distress, and low owner occupancy rates.
- B Markets are also strong markets with high sales prices, low levels of distress, and highest home ownership rates in Bethlehem.
- C Markets were the only block groups with substantial new construction activity and had the highest levels of condominium sales.
- D Markets generally represent “middle” markets with a median sale price ($143,933), slightly below the citywide average. “D” markets also have a roughly even split between owner and renter households, average levels of distress, and average numbers of properties with multiple violations.
- E Markets also represent a portion of the “middle” market, although these block groups have a slightly lower median sales price and greater signs of both distress and investor purchases than “D” markets.
- F Markets have the lowest homeownership rates in the city and are also home to the greatest concentrations of subsidized rental housing. They also had the highest share of investor purchases and mixed signs of stress.
- G Markets are the most stressed in Bethlehem. The median home sales price ($69,047) is the lowest in the city and investors make up nearly half of all residential sales. Over a quarter of properties have multiple violations and elevated levels of blight and distressed.
Philadelphia, PA (2018)
Reinvestment Fund’s Market Value Analysis (MVA) describes the characteristics of the block groups within a study area. The MVA indicators in Philadelphia are noted below and represent the dimensions upon which block groups are analyzed:
- Median Sales Prices, Condo-Adjusted, 2016 – 2018Q2: Median residential sales prices, excluding non-arms-length transactions (sales prices under $1,000), adjusted for sales of condos*, 2016 to 2018Q2 (Philadelphia Office of Property Assessment)
- Variance for Sales, 2016 – 2018Q2: Coefficient of variance for residential sales prices, 2016 to 2018Q2 (Philadelphia Office of Property Assessment)
- Permits, 2016 – 2018Q2: Count of properties with permits for major renovations 2016 to 2018Q2 as share of all residential parcels (Philadelphia Department of License and Inspections)
- New Construction, 2013– 2018Q2: Count of residential properties with permits for new construction 2013 to 2018Q2 as a share of all residential parcels (Philadelphia Department of License and Inspections)
- Vacant Homes and Residential Land, 2018: Count of residential parcels with vacant homes or vacant land as a share of all residential parcels (Philadelphia Office of License and Inspections)
- Foreclosure Filings, 2016 – 2018Q2: Count of residential parcels with foreclosure filing issued between 2016 and 2018Q2 as a share of residential sales (Philadelphia Prothonotary’s Office)
- Housing Density, 2018: Count of housing units per acre (Philadelphia Office of Property Assessment)
- Owner-Occupied Households, 2016: Share of households that owned their home (American Community Survey, 5-year Estimates, 2011-2016)
- Subsidized Rental Housing Units, 2018: Count of subsidized rental housing (including Project Based Section 8, LIHTC, and Vouchers) as a share of all renter-occupied households (Philadelphia Housing Authority, HUD)
- Condominium Presence, 2018: Share of housing units that are located in condominiums (Philadelphia Office of Property Assessment)
 *Median sales prices were adjusted to account for the sale of condos within each block group. Generally, condo sales reduce median home value estimates. For each block group, the median sales price used in the model is the higher of the median price of all arms-length transactions or the median price of all arms-length transactions excluding condos.
**Variable used in final model.
*Median sales prices were adjusted to account for the sale of condos within each block group. Generally, condo sales reduce median home value estimates. For each block group, the median sales price used in the model is the higher of the median price of all arms-length transactions or the median price of all arms-length transactions excluding condos.
**Variable used in final model.
The table below shows each component’s average for each MVA category.
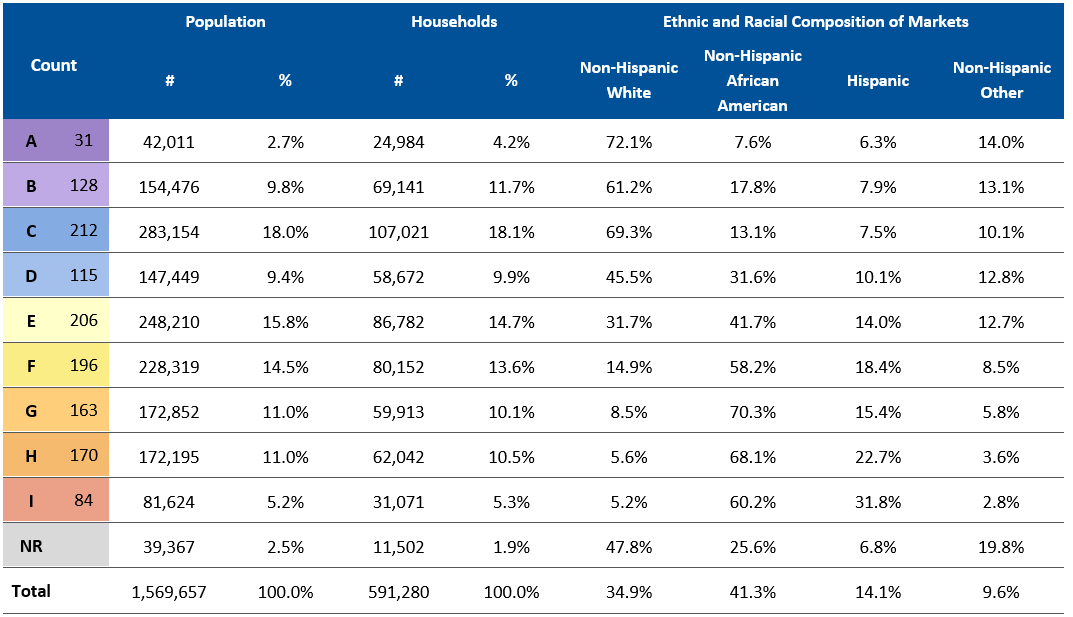
- Market Type A: Highest home sales prices and share of units that are condos. Lowest foreclosure, vacancy and subsidized rental housing rates. High levels of renovation and new construction. Predominantly renters.
- Market Type B: High sale prices and condo presence, largest incidence of private investor activity and new construction. Notable presence of subsidized units compared to other areas with high home prices.
- Market Type C: Highest homeownership rate, moderate foreclosure activity, low vacancy and subsidy rates.
- Market Type D: Sales price close to city median, highest share of renters, high permitting activity but low rates of new construction. Higher than average rates of vacancy and subsidy.
- Market Type E: Median sales prices below city average. Lowest share of permits and little new construction. High homeownership, high foreclosure.
- Market Type F: Low permitting and construction. Highest foreclosure rate. Elevated subsidy and vacancy.
- Market Type G: Highest subsidy usage for renters. Evenly split renters and owners. High foreclosure and vacancy rates.
- Market Type H: Low sale prices, highest rates of vacancy and foreclosure in the city. Roughly one in five renters rely on subsidy.
- Market Type I: Lowest sale prices and highest sale variance, highest vacancy rate. Moderate homeownership. New construction essentially nonexistent.
- Nonresidential Mask: All nonresidential parcels>50,000sf in the Philadelphia Property Appraiser’s file were merged to create a non-residential mask for the county.
- Not Rated: All block groups that had fewer than 5 sales in 2016-2018; these block groups tend to be either entirely rental housing or non-residential uses.
Philadelphia, PA (2015)
Reinvestment Fund’s Market Value Analysis (MVA) describes the characteristics of the block groups within a study area. The MVA indicators in the 2015 MVA for Philadelphia are noted below and represent the dimensions upon which block groups are analyzed:
- Median Sale Price: Philadelphia Office of Property Assessment’s (OPA) file of all recorded deeds between 1/1/2013 through 6/30/2015 for residential sales of $1,000 or more. Median sales price has been calculated both with and without condominiums; the model uses the higher of the two for all blockgroups.
- Coefficient of Variation: The coefficient of variation, derived from the OPA file, represents the variability of sale prices within the block group. (High numbers represent places with wide variations in sale prices.) The coefficient of variation (CV) is defined as the ratio of the standard deviation to the mean. CV = std dev / mean
- Percent Owner-Occupied: U.S. Census, American Community Survey data (2009-2013) representing the percent of all occupied housing units that are occupied by owners.
- Percent Vacant: Philadelphia Department of License and Inspections’ inventory of vacant housing in Philadelphia, 2010-2014, divided by the total number of housing units.
- Percent New Construction: Philadelphia Office of Property Assessment records of all new residential properties built 2008-2015 as a percent of all residential parcels.
- Foreclosure as a Percent of Sales: This figure represents all foreclosure filings 2013-2015Q2 (Philadelphia Prothonotary’s Office) divided by the number of sales in 2013-2015Q2 (OPA).
- Percent Public/Assisted Housing: Represents Philadelphia Public Housing Authority owned developments and HUD-assisted rental housing developments (permanent housing units, not housing choice vouchers) divided by the number of renter-occupied housing units (ACS 2009-2013).
- Housing Density: Housing units (ACS 2009-2013) per acre of residential land area (OPA)
- Percent Permits: Philadelphia Department of License and Inspections’ inventory of residential properties with building permits 2013-2015 as a percent of residential properties (OPA)
- Percent Condominium: Percent of all single family residential parcels that are classified as condominiums (OPA)
The table below shows each component’s average for each MVA category.
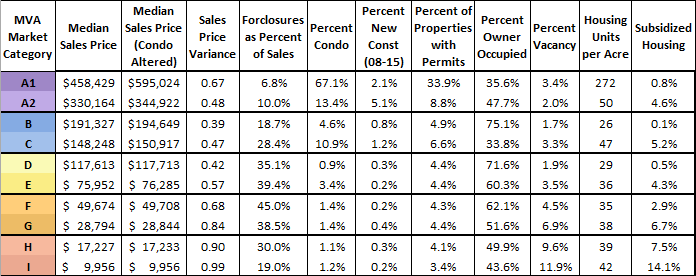
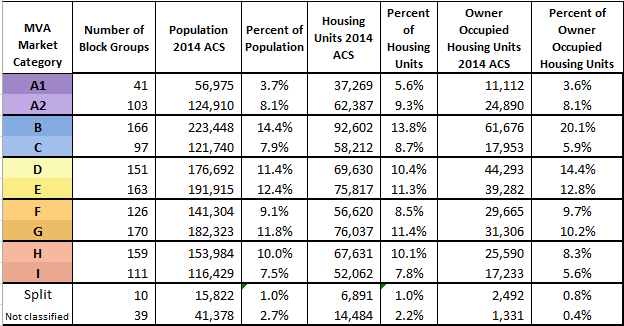
- Regional Choice (A1): Highest home prices, highest percent of condominiums, highest density, low number of foreclosure filings relative to sales volume, second lowest owner occupancy rate, highest level of permit activity.
- Regional Choice (A2): High home prices, second lowest foreclosure rate relative to sales volume, relatively low percent owner occupied compared to the citywide average.
- Steady (B): Relatively high home prices, lowest sales price variance, low level of new construction, highest home ownership rate, lowest density, lowest level of subsidized housing.
- Steady (C): Home prices above citywide median, third highest level of condominiums, substantially higher foreclosures as a percent of sales than A-C categories, lowest level of homeownership.
- Transitional (D): Home prices equal to or slightly above citywide median, second lowest level of vacancies, second highest homeownership rate, second lowest density, lowest amount of condominiums, negligible amount of new construction, second lowest variance in sale prices.
- Transitional (E): Sales prices below city median, second highest rate of foreclosures as a percent of sales, negligible amount of new construction, homeownership rate above the city average (53% per the ACS 2009-2013).
- Stressed (F): Third highest homeownership rate compared to other categories, home prices below the citywide average, highest number of foreclosures as a percent of sales.
- Stressed (G): Homeownership at or slightly below citywide average, home prices well below the citywide median, third highest number of foreclosures as a percent of sales, third highest percent of public/assisted housing.
- Distressed (H): Very low home values, second highest sales price variance, equal to or slightly below the citywide average homeownership rate, second highest level of vacancies, second highest level of subsidized housing.
- Distressed (I): Lowest home sale prices, highest vacancy rate, third lowest level of homeownership, lowest level of permit activity, highest level of publicly assisted rental housing.
Philadelphia, PA (2011)
In 2011, Reinvestment Fund developed a Market Value Analysis for the City of Philadelphia.
- Median and Mean Sale Price: Philadelphia Board of Revision of Taxes’ (BRT) file of all recorded deeds between 1/1/2010 through 12/31/2011 for residential sales of $1,000 or more. Only the Median Sale Price was used in the MVA model.
- Coefficient of Variation: The coefficient of variation, derived from the BRT file, represents the variability of sale prices within the block group. (High numbers represent places with wide variations in sale prices.)
- Percent Owner-Occupied: U.S. Census data (2010) representing the percent of all occupied housing units that are occupied by owners.
- Percent Vacant: Philadelphia Department of License and Inspections’ inventory of vacant land and housing in Philadelphia, 2009-2012, divided by the total number of housing units.
- Percent New Construction: Philadelphia Department of Licenses and Inspections’ records of all permits issued between 1/1/2010 through 12/31/2011 for new construction and substantial rehabilitation of properties.
- Percent Commercial: Philadelphia Department of City Planning’s Land Use File. This figure represents commercial land – not including parking lots – divided by all developed land.
- Foreclosure as a Percent of Sales: Philadelphia Prothonotary’s Office’s file of foreclosure filings 2010-Q1 2011. This figure represents all foreclosure filings 2010-Q1 2011 divided by the number of sales in 2010-2011 (from BRT).
- Percent Public/Assisted Housing: Represents Philadelphia Public Housing Authority owned developments and HUD-assisted rental housing developments (permanent housing units, not housing choice vouchers) divided by the 2010 Census number of renter-occupied housing units.
The table below shows each component’s average for each MVA category.
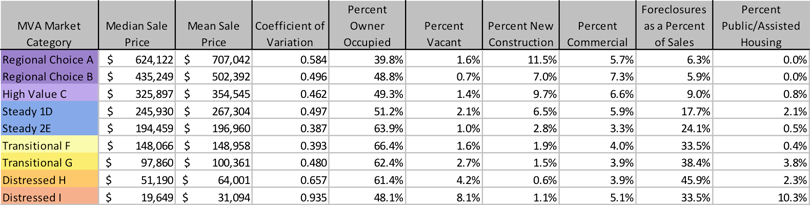
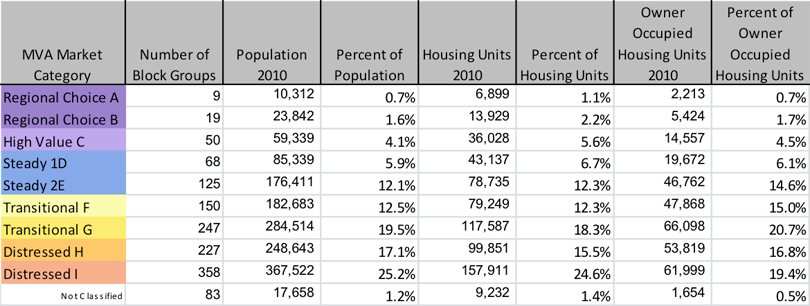
- Regional Choice (A): Highest home prices, low number of foreclosure filings relative to sales volume, lowest owner occupancy rate, highest level of new construction activity.
- Regional Choice (B): High home prices, lowest foreclosure rate relative to sales volume, relatively low percent owner occupied compared to the citywide average, highest percent commercial mix.
- High Value (C): Relatively high home prices, high level of new construction, relatively low ownership rate compared to the citywide average.
- Steady 1 (D): Relatively high home prices compared to the citywide average, , fairly active level of new construction, substantially higher foreclosures as a percent of sales than Regional Choice and High Value categories.
- Steady 2 (E): Second lowest level of vacancies, second highest homeownership rate, lower level of new construction compared to previous categories, lowest coefficient of variance in sale prices.
- Transitional (F): Highest homeownership rate, higher foreclosures as a percent of sales than previous categories, second lowest coefficient of variance in sales prices.
- Transitional (G): High homeownership rate compared to other categories, home prices below the citywide average, high number of foreclosures as a percent of sales, second highest percent of public/assisted housing.
- Distressed (H): Highest percent of foreclosures as a percent of sales, relatively low home prices, high homeownership rate, elevated vacancies.
- Distressed (I): Lowest home sale prices, highest vacancy rate, below average owner occupancy rate, highest level of publicly assisted rental housing.
Philadelphia, PA (2008)
In 2008, Reinvestment Fund developed a Market Value Analysis for the City of Philadelphia.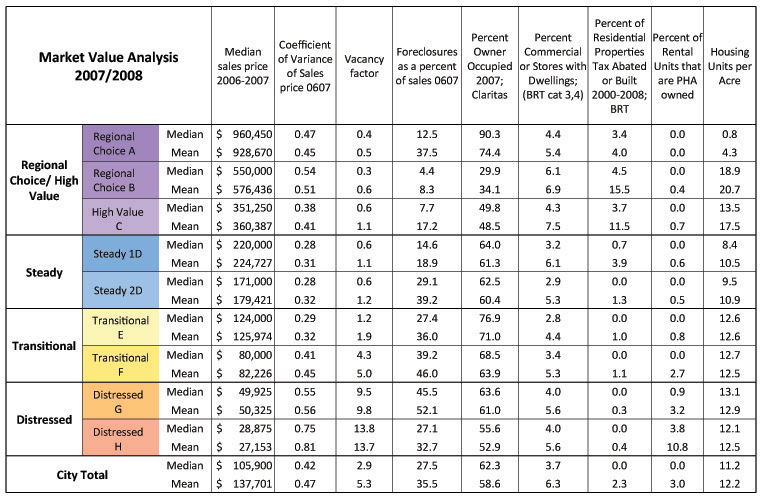
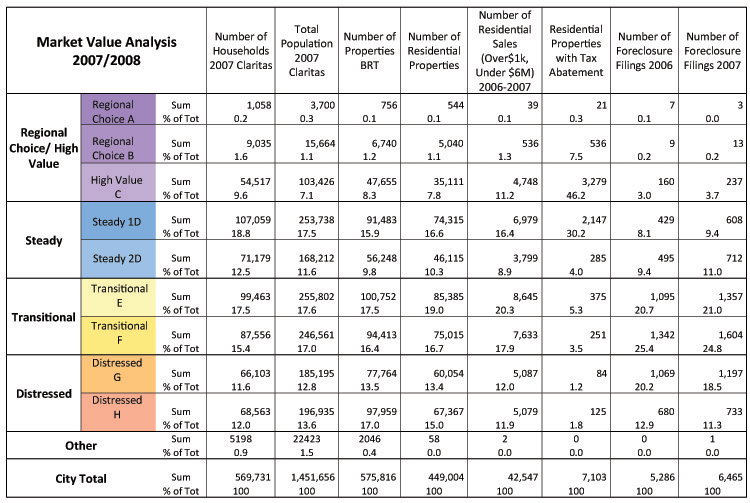
Reinvestment Fund cluster analysis revealed eight market types, characterized as follows:
- Regional Choice A: highest home prices, lowest number of foreclosure filings, high percent owner occupied.
- Regional Choice B: low foreclosure, low percent owner occupied, relatively high percent commercial mix.
- High Value C: high number of residential properties with tax abatements, relatively high home prices, high residential density.
- Steady 1D: relatively high homeownership, home prices relatively high and stable, few vacancies.
- Steady 2D: few vacancies, relatively high homeownership, high number of residential properties with tax abatements.
- Transitional E: relatively high and steady home prices and population shifts.
- Transitional F: high number of foreclosures, population shifts, relatively high density.
- Distressed G: high number of foreclosures, relatively low home prices, population shifts, elevated vacancies.
- Distressed: lower home prices, high vacancy rate, predominantly homeowners, much publicly assisted housing.
Philadelphia, PA (2001)
In 2001, Reinvestment Fund developed a Market Value Analysis for the City of Philadelphia.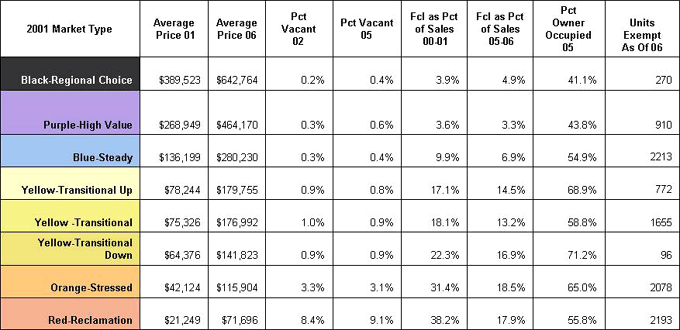
Reinvestment Fund cluster analysis revealed eight market types, characterized as follows:
- Regional Choice: highest home prices, mix of uses, older homes in excellent condition.
- High Value: high home prices, price appreciation, population stability and some growth, less commercial activity, high rate of homeownership.
- Steady: predominantly homeowners, home prices relatively high and stable, homes in good condition, few vacancies.
- Transitional (Up): relatively high and steady home prices and population shifts.
- Transitional (Steady): steady home prices, no robust appreciation, population shifts.
- Transitional (Down): population shifts, worn housing, dangerous properties, elevated vacancies.
- Distressed: lower home prices, physical decay, older homes, elevated vacancies, predominantly homeowners, much publicly assisted housing, substantial population loss.
- Reclamation: population loss, low property values, physical deterioration, hyper-abandonment, dangerous buildings.
Reading, PA
In 2011 Reinvestment Fund developed a Market Value Analysis of Reading, Pennsylvania for Reading, Berks County, Pennsylvania.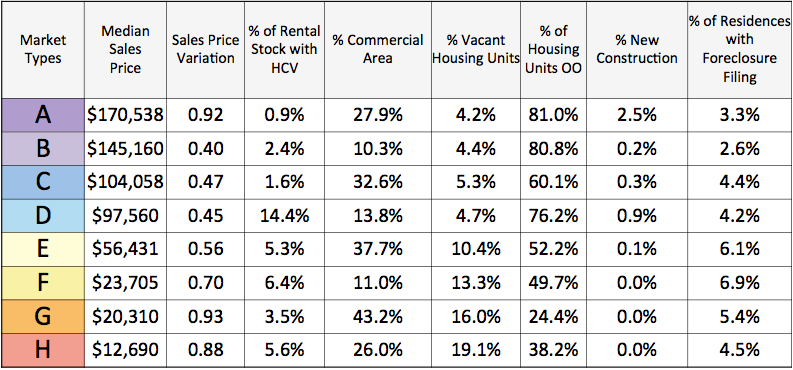
Reinvestment Fund cluster analysis revealed eight market types, characterized as follows:
- Dark Purple: highest median sales price, highest sales price variation, some commercial presence, moderate foreclosure rate, highest rate of new construction.
- Light Purple: high owner occupancy, low amount of commercial, high residential sales price, lowest foreclosure rate, lower rate of new residential construction.
- Dark Blue: moderate owner occupancy, high percent commercial, moderate foreclosure rate, and relatively high sale prices.
- Light Blue: low percent commercial, average foreclosure rate, relatively high sale prices.
- Light Yellow: moderate owner occupancy, high percent commercial, moderate sale prices, very low rate of new residential construction.
- Yellow: relatively high percent vacancy, fairly low median sales price, and relatively low percent commercial.
- Orange: no new construction activity, lowest owner occupancy, low residential sales price, high percent of foreclosures, highest home sale price variation.
- Red: lowest median sales price, highest vacancy rate, moderate foreclosure rate, lower owner occupancy.
TEXAS
Dallas, TX (2017)
Reinvestment Fund’s Market Value Analysis (MVA) describes the characteristics of the block groups within a study area. The MVA indicators in Dallas are noted below and represent the dimensions upon which block groups are analyzed:- Median Sales Price: Median residential real estate sales price for sales of $1,000 or more from 2015 (Q3&4) through 2017 (Q1&2). Reinvestment Fund imputed a price to rent equivalence for block groups with less than 5 sales and high levels of rental occupancy based on ACS median gross rent and Zillow price to rent index. The data source for sales price is InfoUSA.
- Coefficient of Variation of Sales Price: The coefficient of variation describes the variability of sale prices within the block group. The coefficient of variation is calculated by dividing the standard deviation of sale prices by the mean. The data source is InfoUSA.
- Percent Mortgage Foreclosure: Foreclosure listings from 2015 (Q3&4) through 2017 (Q1&2) as a percentage of owner occupied households. The data source is the Foreclosure Listings Service.
- Residential Vacancy: Residential vacancy is the percentage of residential addresses where mail has not been collected for at least 90 days. The residential vacancy indicator was calculated as an average of the first through fourth quarters of 2016. The data source is Valassis Lists.
- Percent of New Construction Units: New construction activity was measured by calculating the percent of permitted new consturction units from 2015 (Q3&4) through 2017 (Q1&2) as a percentage of all housing units. The data source is the City of Dallas Department of Planning & Urban Design.
- Percent of Rehab Permits: Parcels with a total permit value of $1,000 or more from 2015 (Q3&4) through 2017 (Q1&2) as a percentage of all housing units. The data source is the City of Dallas Department of Planning & Urban Design.
- Percent of Parcels with a Code Violation Lien: Percent of residential parcels with a code violation lien from 2015 (Q3&4) through 2017 (Q1&2). The data source is the City of Dallas Department of Code Compliance.
- Owner occupied units as a % of occupied units: 2015 American Community Survey data (from the Census Bureau) representing the percent of all occupied housing units that are occupied by owners.
- Percent Subsidized Rental Units: Subsidized rental units are measured as the sum of units in public housing developments, multi-family assistance properties, LIHTC developments, housing choice vouchers, and locally subsidized units divided by the number of rental units. The data source is the City of Dallas Department of Planning & Urban Design.
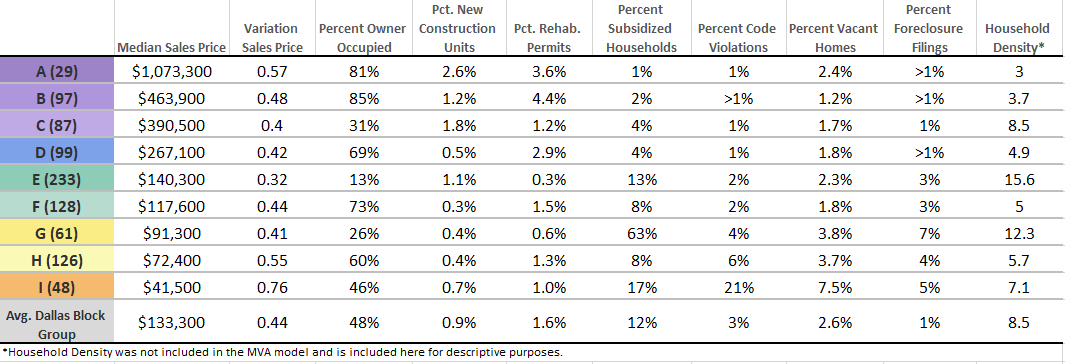 Population and Housing Distribution by Market Type
Reinvestment Fund’s cluster analysis revealed nine market types, characterized as follows:
Population and Housing Distribution by Market Type
Reinvestment Fund’s cluster analysis revealed nine market types, characterized as follows:
- Regional Choice “A”: Highest home values, largest level of new construction, high owner occupancy levels, and little housing distress (such as residential vacancy and foreclosure).
- Regional Choice “B”: Elevated home values, highest amounts of rehab. permits, highest levels of owner occupancy, and little housing distress.
- Regional Choice “C”: Elevated home values, above average levels of new construction, high levels of renter occupancy, and little housing distress.
- Steady “D”: Double average home values, high levels of rehab. permits, more owners than renters, and low levels of foreclosure and residential vacancy.
- Steady “E”: About average home values, highest household density, highest levels of renter occupancy, some residential vacancy and foreclosure.
- Steady “F”: Home values slightly below the citywide average, little new construction, more owners than renters, and about average levels of foreclosure and residential vacancy.
- Transitional “G”: Below average home values, little new construction, more renters than owners, and highest levels of subsidized rentals.
- Transitional “H”: Home values well below the citywide average, little new construction, more owners than renters, elevated levels of residential vacancy and foreclosure.
- Distressed “I”: Lowest home values in Dallas, slightly below average levels of new construction, about an even share of owners and renters, the highest levels of residential code violation liens, vacancy, and foreclosure.
Houston, TX (2016)
Reinvestment Fund’s Market Value Analysis (MVA) describes the characteristics of the block groups within a study area. The MVA indicators in Houston are noted below and represent the dimensions upon which block groups are analyzed:- Median sales price: The middle value of residential sales, where half the sales are above the calculated median value and half are below. Median sales price is calculated from InfoUSA’s nationwide database file of all recorded sales between 1/1/2014 through 12/31/2015. Sales were filtered for residential sales greater than $1,000 and less than $4 million.
- Variability of sales prices: The coefficient of variation, derived from the InfoUSA database of sales, represents the variability of sale prices within the block group. (High numbers represent places with wide variations in sale prices.)
- Foreclosure filings as a percent of sales: Harris County’s foreclosure filings starting in April 2014 through August 2016, derived from Constables’ Foreclosure Auction Daily Court Review publication. This figure represents all foreclosure filings from April 2014 through August 2016 divided by the number of sales in 2014-2015 (from InfoUSA database).
- Vacant properties as a % of housing units: Harris County properties with water service shut off (as of August 2016) + City of Houston Dept. of Neighborhoods dangerous buildings (as of Oct 2016) + Harris County demolished residences (2014-2016, courtesy of the Kinder Institute), divided by the total number of residential housing units (ACS 2015). Parcels which had both a demolished residence and a new construction permit were removed.
- Building permits as a % of housing units: City of Houston records of all building permits (single family and multifamily construction) issued between 1/1/2014 through 12/31/2015, divided by the total number of residential housing units (ACS 2015).
- Owner occupied units as a % of occupied units: 2015 American Community Survey data (from the Census Bureau) representing the percent of all occupied housing units that are occupied by owners.
- Subsidized rental stock as a % of rental units: The sum of units owned and/or managed by the Houston Housing Authority, rental assisted housing units from the City of Houston and Houston Housing Authority, and Low-Income Housing Tax Credit (LIHTC) units, divided by the number of occupied rental units (ACS 2015).
- Commercial or industrial area as % of all land area: From the Houston-Galveston Area Council land use parcel file, this figure represents the land area categorized as non-residential divided by the sum of all land use types, 2016.
- Housing violations as a % of housing units: From the City of Houston building citations and violations file, this figure represents citations from 1/1/2014 through 6/31/2016 divided by the number of housing units (ACS 2015).

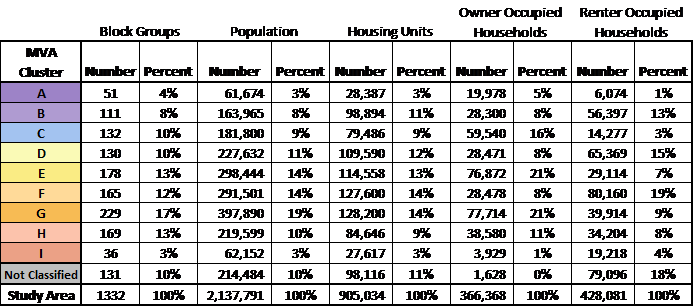 Population and Housing Distribution by Market Type
Reinvestment Fund’s cluster analysis revealed nine market types, characterized as follows:
Population and Housing Distribution by Market Type
Reinvestment Fund’s cluster analysis revealed nine market types, characterized as follows:
- Market Type A: Highest home prices, lowest number of foreclosure filings relative to sales volume (foreclosure rate), high number of permits relative to housing units, percent owner occupied well above the citywide average.
- Market Type B: High home prices, second lowest foreclosure rate relative to sales volume, percent owner occupied below the citywide average.
- Market Type C: Relatively high home prices, highest percent owner occupied, foreclosure rate as a percentage of sales substantially below the citywide average.
- Market Type D: Home prices are comparable to the citywide average, foreclosures as a percentage of sales are comparable to other middle markets, percent owner occupied below the citywide average.
- Market Type E: Home prices are below the citywide average, third highest homeownership rate, foreclosures as a percent of sales below the citywide average.
- Market Type F: Homeownership rate well below the citywide average, elevated foreclosures as a percent of sales, home prices significantly below the citywide average.
- Market Type G: Fourth highest homeownership rate, home prices substantially below the citywide average, third highest average number of foreclosures as a percent of sales, comparable vacancy rate relative to citywide average.
- Market Type H: Second lowest home sale prices, highest coefficient of variance of sales, highest percent of publicly subsidized rental, highest percent for vacancy as share of housing units, and highest foreclosures as a percent of sales.
- Market Type I: Lowest home sale prices, lowest owner occupancy rate, second highest coefficient of variance of sales, second highest foreclosures as a percent of sales.
Houston, TX (2013)
Reinvestment Fund’s Market Value Analysis (MVA) describes the characteristics of the block groups within a study area. The MVA indicators in Houston are noted below and represent the dimensions upon which block groups are analyzed:- Median sales price: The middle value of residential sales, where half the sales are above the calculated median value and half are below. Median sales price is calculated from InfoUSA’s nationwide database file of all recorded sales between 1/1/2010 through 12/31/2011. Sales were filtered for residential sales greater than $1,000 and less than $2 million.
- Variability of sales prices: The coefficient of variation, derived from the InfoUSA database of sales, represents the variability of sale prices within the block group. (High numbers represent places with wide variations in sale prices.)
- Foreclosure filings as a percent of sales: Harris County’s foreclosure filings 2010 through 2011, derived from Constables’ Foreclosure Auction Daily Court Review publication. This figure represents all foreclosure filings in 2010 and 2011 divided by the number of sales in 2010-2011 (from InfoUSA database).
- Residential water shutoffs as a % of housing units: Harris County’s report of properties where water service has been shut off as of August 2012 – divided by the total number of residential housing units. This is an indicator of vacancy.
- Building permits as a % of housing units: City of Houston records of all building permits (demolition, single family construction, and multifamily construction) issued between 1/1/2010 through 12/31/2012, divided by the total number of residential housing units.
- Owner occupied units as a % of occupied units: 2010 US Census data representing the percent of all occupied housing units that are occupied by owners.
- Public housing subsidies of rental stock as a % of rental units: The sum of units owned and/or managed by the Houston Housing Authority and rental assisted housing units from the City of Houston and Harris County in 2012, divided by the number of rental units.
- Commercial or industrial area as % of all land area: From the Harris County Appraisal District File, this figure represents the land area categorized as non-residential divided by the sum of all land use types.
- Housing violations as a % of housing units: From the Harris County building violations file, this figure represents all violations from 1/1/2010 through 12/31/2012 divided by the number of housing units.
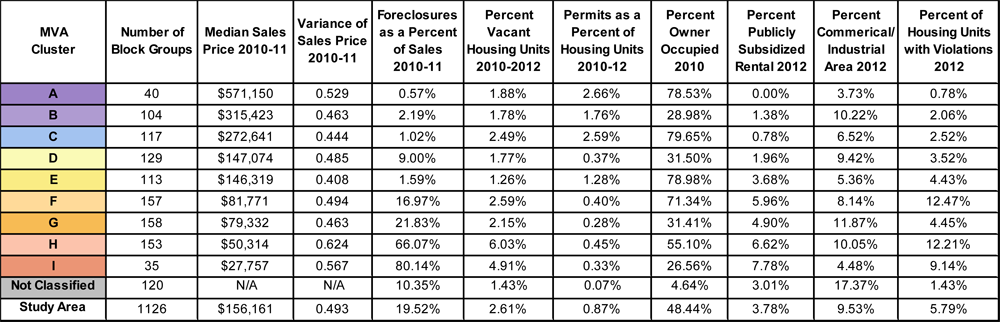
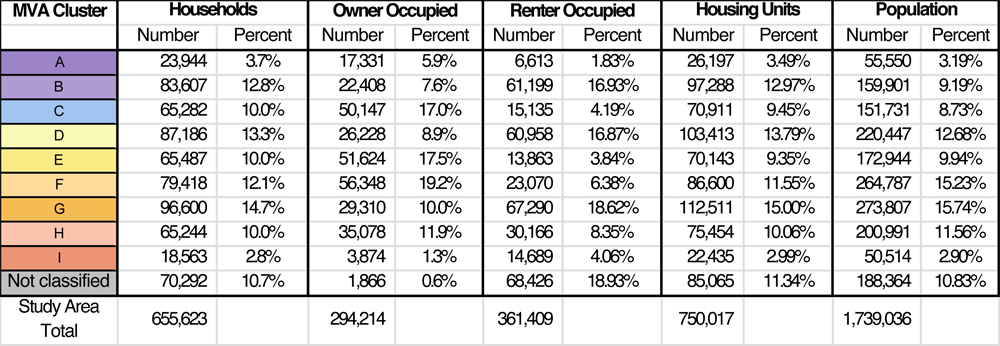 Reinvestment Fund’s cluster analysis revealed nine market types, characterized as follows:
- Market Type A: Highest home prices, lowest number of foreclosure filings relative to sales volume (foreclosure rate), highest number of permits relative to housing units, percent owner occupied well above the citywide average.
- Market Type B: High home prices, second lowest foreclosure rate relative to sales volume, percent owner occupied substantially below the citywide average.
- Market Type C: Relatively high home prices, highest percent owner occupied, foreclosure rate as a percentage of sales substantially below the citywide average.
- Market Type D: Home prices are comparable to the citywide average, foreclosures as a percentage of sales are elevated relative to other middle markets, percent owner occupied substantially below the citywide average.
- Market Type E: Home prices that are comparable to the citywide average, second highest homeownership rate, foreclosures as a percent of sales below than the citywide average.
- Market Type F: Homeownership rate above the citywide average, elevated foreclosures as a percent of sales, highest number of violations as a percent of housing units, home prices below the citywide average.
- Market Type G: third lowest homeownership rate, home prices below the citywide average, above average number of foreclosures as a percent of sales, percent water shut-offs that are similar to the citywide average.
- Market Type H: Second lowest home sale prices, highest coefficient of variance of sales, second highest percent of publicly subsidized rental, highest percent water shut-offs.
- Market Type I: Lowest home sale prices, lowest owner occupancy rate, second highest coefficient of variance of sales, second highest percent water shut-offs, highest percent of publicly subsidized rental.
VIRGINIA
Richmond, VA (2017)
Reinvestment Fund’s Market Value Analysis (MVA) describes the characteristics of the block groups within a study area. In 2017, Reinvestment Fund developed a Market Value Analysis for the City of Richmond, VA. Reinvestment Fund’s cluster analysis revealed nine market types, characterized as follows: Market Type A- 32 of the region’s 461 block groups have been characterized as “A” markets.
- 8.8% (68,848) of the region’s 2011-2015 population and 7.9% (23,926) of its households.
- Typical home sales price in “A” markets is approximately $501,292, nearly 2.5 times the regional median.
- Highest average percentage of properties (5.9%) that have been built in the last 10 years
- Elevated rates of permitting activity (11.6%) relative to the regional average.
- Owner occupancy rates (90.1%) well above the regional average.
- “A” markets have the lowest level of bank sales (2.6% of sales) in the region.
- There are few publicly subsidized rental housing options in these markets (0.4% of all rental units).
- “A” markets are the least dense housing market with an average only 1.9 housing units per residential acre.
- High 23 of the region’s 461 block groups have been characterized as “B” markets.
- Highest density of all of the markets at an average of 17.2 housing units per residential acre
- 5.3% (41,700) of the region’s 2011-2015 population and 6.7% (20,252) of its households.
- At nearly $426,000, the “B” markets’ typical home sales price is just over two times the regional median.
- Permitting activity (5.0%) is slightly below the regional average.
- “B” markets are predominantly renter occupied, with 33% of all households being owner occupied.
- 82 of the region’s 461 block groups have been characterized as “C” markets.
- More suburban in form, with an average of 3.2 housing units per acre
- 19.9% (155,458) of the region’s 2011-2015 population and 19.5% (58,660) of its households.
- Home sale prices ($274,479) above the regional average.
- Permitting activity (7.2%) is second highest in the region.
- Predominantly owner occupied (83%); of the limited number of rental properties, few (3%) are publicly subsidized.
- The average rate of bank sales, 6%, is double that of “A” and “B” markets.
- 53 of the region’s 461 block groups have been characterized as “D” markets.
- 11.9% (92,974) of the region’s residents and 13.2% (39,877) of its households.
- The typical home sale prices in “D” markets ($195,175) is just under the regional average.
- Permitting activity in “D” markets (5.7%) is just under the regional average.
- Lowest average homeownership rate (29%)
- Second highest density (9.8 units per acre) of all of the markets.
- Comprise over 28,700 rental households, with an average of 7% receiving some form of subsidy.
- 103 of the region’s 461 block groups were characterized as “E” markets.
- These block groups were home to 22.8% (178,048) of the region’s 2011-2015 population and 21.6% of its households.
- The typical home sales price in “E” markets is approximately $182,686, roughly 10% below the regional average.
- The market is largely (80%) owner occupied, third highest in the region.
- Bank sales are roughly equal to the regional average.
- Percent of presidential properties built since 2008 (2.6%) is slightly below the regional average.
- Permitting activity in “E” markets (5.5%) is slightly below the regional average.
- 30 of the region’s 461 block groups were characterized as “F” markets.
- 6.8% (53,482) of the region’s 2011-2015 population and 7% (20,978) of its households.
- The typical home sales price in “F” markets is approximately $140,358, just over two-thirds the regional average
- On average, 21% of all sales are bank sales.
- Permitting activity in “F” markets (10.6%) is the third highest rate in the city.
- These markets are nearly evenly split between owners (48%) and renters.
- Of the renter households, an average of 77% per block group are receiving public subsidy; the second highest level in the region.
- 62 of the region’s 461 block groups were characterized as “G” markets.
- 11.6% (90,655) of the region’s 2011-2015 population and 11.8% (35,626) of its households.
- At $117,611, typical home sales prices in these “G” markets are just above half the regional average.
- In a typical block group, nearly 30% of all sales are by banks.
- An average of 59% of households own their home, the fourth highest average of all markets.
- Of the renter occupied households, on average 6.5% of them are subsidized.
- The third highest vacancy rate (3%) of all market types.
- Permitting activity in “G” markets (4.9%) is below the regional average.
- 31 of the region’s 461 block groups were characterized as “H” markets.
- 4.1% (32,453) of the region’s 2011-2015 population and 3.9% (11,640) of its housing units.
- The typical home sales price in “H” markets is $63,465, just below one-third the regional average.
- On average, bank sales account for 32.8% of all sales in “H” block groups.
- Permitting activity in “H” markets (3.7%) is the second lowest of all market types.
- “H” markets typically have 41% homeowners and 59% renters.
- On average 12% of renter households receive public rental subsidy, the third highest percentage among market types.
- Average vacancy rates in “H” markets (8.5%) are the highest in the region and over 2.5 times as high as the next highest market.
- 18 of the region’s 461 block groups were characterized as “I” markets.
- These block groups are the third most densely built (7.2 units per residential acre)
- 3.3% (26,112) of the region’s 2011-2015 population and 3.1% (9,401) of its households.
- The typical home sales price in these “I” markets is $53,597, approximately 25% of the Richmond regional average.
- Permitting activity in “I” markets is the lowest in the region at 2.0%.
- “I” markets typically have 30% homeowners and of the 70% that are renters.
- On average, 89% of the renter households are receiving some form of subsidy.
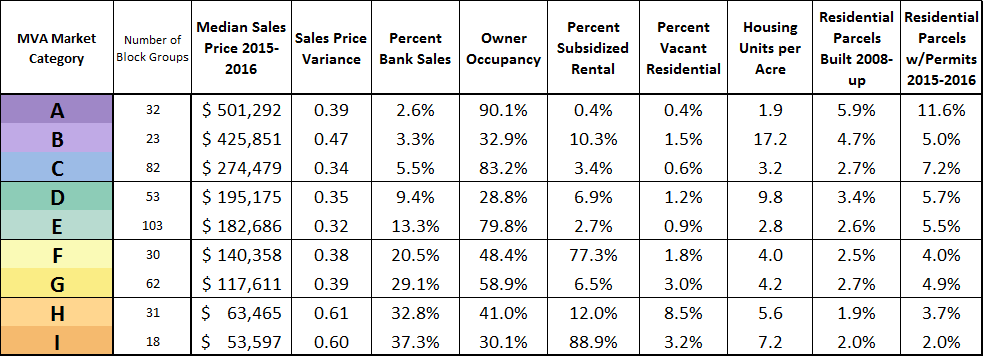
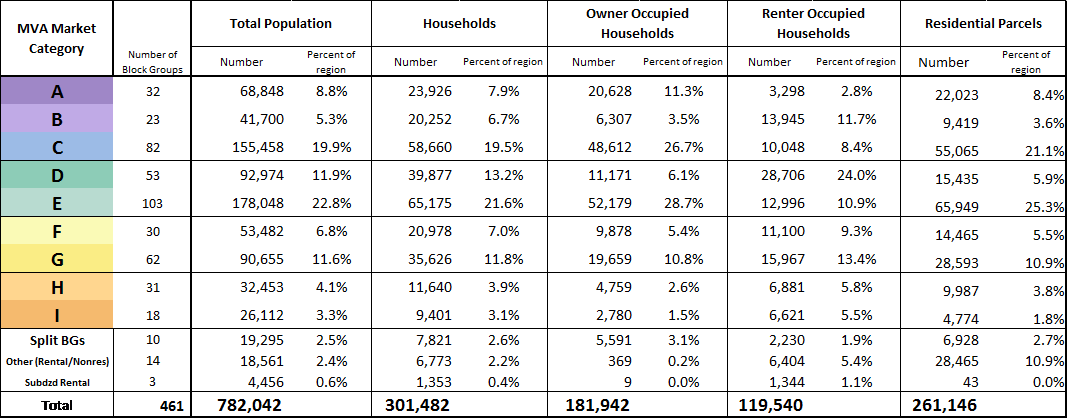
WASHINGTON, DC
In 2006 Reinvestment Fund developed a Market Value Analysis for Washington, DC.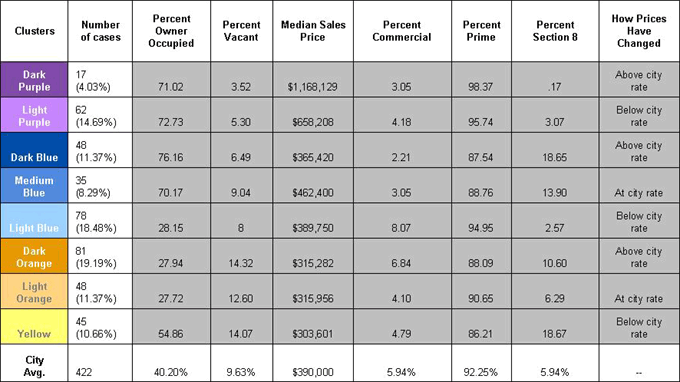
Reinvestment Fund cluster analysis revealed eight market types, characterized as follows:
- Dark purple: highest median sales price, lowest percent vacant and highest percent prime loans.
- Light purple: high percentage owner occupied and relatively high median sales price.
- Dark blue: highest percent owner occupied, lowest percent commercial, relatively low percent prime loans, highest percent of Section 8 housing at 19%.
- Medium blue: higher than average sale prices, and average rate of vacancy.
- Light blue: low percent owner occupied, highest percent commercial, average sale prices.
- Dark orange: very low percent owner occupied, highest percent vacant, below average median sales price.
- Light orange: lowest percent owner occupied, below average sale prices, high rate of vacancy
- Yellow: above average owner occupancy, lowest median sales price, lowest percent prime loans, high rate of vacancy.
WISCONSIN
Milwaukee, WI
Reinvestment Fund’s Market Value Analysis (MVA) describes the characteristics of the block groups within a study area. The MVA indicators in Milwaukee are noted below and represent the dimensions upon which block groups are analyzed:
- Median and Average Sales Price: Office of the City Assessor file of all recorded sales between 1/1/2011 through 12/31/2012 for residential sales of $1,000 or more. Only the Median Sale Price was used in the MVA model.
- Coefficient of Variation: The coefficient of variation, derived from the City Assessor’s file of sales, represents the variability of sale prices within the block group. (High numbers represent places with wide variations in sale prices.)
- Foreclosure as a Percent of Sales: Milwaukee Office of City Development’s file of foreclosure filings 2011 through 2012. This figure represents all foreclosure filings in 2011 and 2012 divided by the number of sales in 2011-2012 (from City Assessor’s file).
- Percent Duplex/Multi-Fam Sales: Milwaukee City Master File representing all multi-unit properties sold divided by the total number of sales 2011-2012 (from City Assessor’s file).
- Percent Water Shut-off: Milwaukee City Water Department file of properties where water service has been shut off divided by the total number of residential properties. This is an indicator of vacancy.
- Percent New Construction/>$10K Rehab: Milwaukee Department of Neighborhood Services records of all building permits issued between 1/1/2010 through 12/31/2012 for new construction and substantial rehabilitation (estimated value greater than $10,000) of properties divided by the total number of residential properties.
- Percent Owner-Occupied: Milwaukee City Master File representing the percent of all occupied housing units that are occupied by owners.
- Percent Publicly Subsidized Rental: Represents Milwaukee Public Housing Authority owned developments, and HUD-assisted rental housing developments including Housing Choice Vouchers from both the City of Milwaukee and Milwaukee County, divided by the number of renter-occupied housing units from the City Master File.
- Percent Non-Residential Area: Milwaukee City Master File. This figure represents non-residential land – not including parking lots – divided by all developed land.
The tables below show each component’s average for each MVA category.

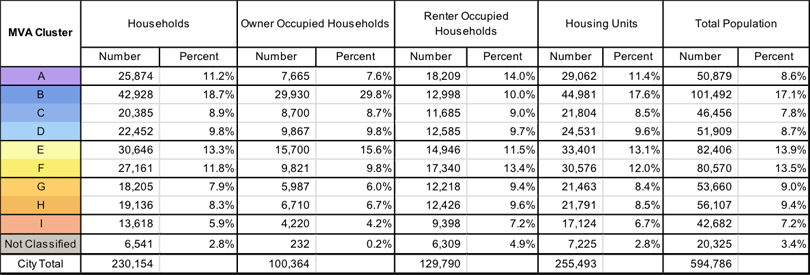
Reinvestment Fund cluster analysis revealed nine market types, characterized as follows:
- Market Type A: Highest home prices, lowest number of foreclosure filings relative to sales volume (foreclosure rate), second lowest owner occupancy rate, second highest percentage of sales that are duplex or multi-family.
- Market Type B: High home prices, second lowest foreclosure rate relative to sales volume, highest percent owner occupied, lowest coefficient of variance of sales price.
- Market Type C: Relatively high home prices, highest percentage of non-residential land, foreclosure rate as a percentage of sales substantially below the citywide average.
- Market Type D: Relatively high home prices compared to the citywide average, foreclosures as a percentage of sales below the citywide average, percent of sales that are multi-unit are above the citywide average.
- Market Type E: Home prices that are substantially below the citywide average, second highest homeownership rate, highest percentage of publicly subsidized rental, foreclosures as a percent of sales higher than the citywide average.
- Market Type F: Second highest percentage of non-residential area, higher foreclosures as a percent of sales than the citywide average, higher percent of sales that are multi-unit than the citywide average.
- Market Type G: Second lowest homeownership rate, home prices below the citywide average, high number of foreclosures as a percent of sales, highest percentage of sales that are multi-unit, percent water shut-offs that are substantially higher than the citywide average.
- Market Type H: Second lowest home sale prices, percentage of sales that are multi-unit below the citywide average, second highest coefficient of variance of sales, second highest percent of publicly subsidized rental, percent water shut-offs that are substantially higher than the citywide average.
- Market Type I: Lowest home sale prices, highest vacancy rate, lowest owner occupancy rate, highest coefficient of variance of sales, highest percent water shut-offs.
Also, it is worth noting that the Milwaukee MVA widget also includes additional data layers that are not on the PolicyMap maps page and were not included in the MVA analysis, and thus are not listed above. These include the Total Number of Establishments, Total Number of Employees, and Total Number of Sales, which are all from the National Establishment Time-Series (NETS). PolicyMap received these layers, as well as residential sales indicators, from Reinvestment Fund’s Policy Solutions department.