
The Power of Intersection: Multi-Layer Maps
Reintroducing Multi-Layer Maps
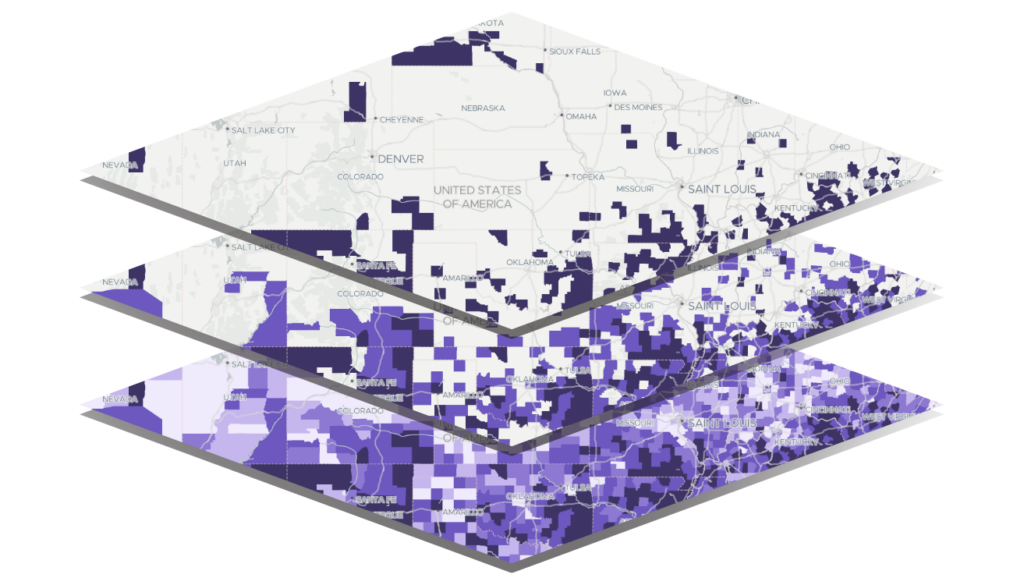
The Multi-Layer mapping tool is one of the most powerful features in the PolicyMap platform. It allows users to combine up to five data layers, apply conditions to each, and quickly identify geographic areas where those layers intersect or overlap.
While Multi-Layer Maps have long been central to PolicyMap’s analytical capabilities, we’ve spent the past year quietly enhancing the tool to deliver even greater flexibility and value. Today, we’re reintroducing Multi-Layer Maps with several highly requested improvements, including expanded zoom levels, map clipping, and the ability to download multi-layer data.
What does this look like in practice? Multi-Layer Maps are designed for exactly the kinds of real-world questions practitioners face every day, questions that require combining multiple criteria to pinpoint places of greatest need or opportunity.
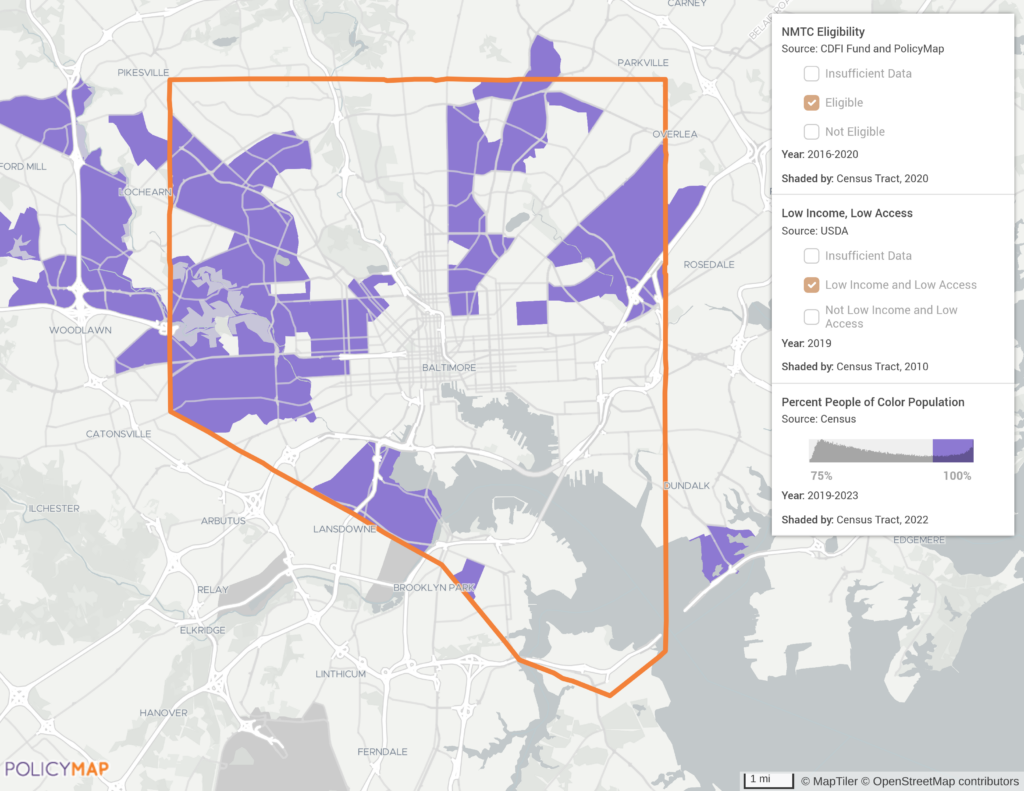
For example, let’s say you’re a Community Development Financial Institution (CDFI) targeting high-impact community development investments and need to find areas that are eligible for New Markets Tax Credits AND are designated as low food access areas AND where the population is predominantly people of color. Enter Multi-Layer Maps!
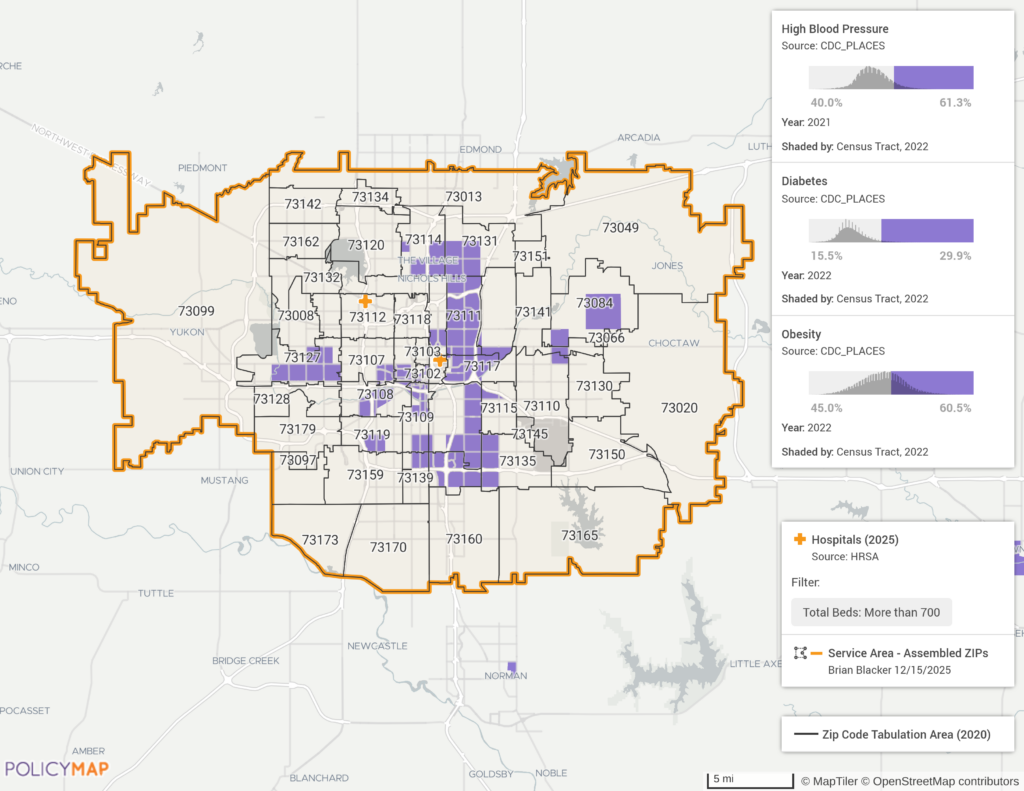
In another example, a hospital network may want to identify hotspots within a service area where the rates of certain comorbidities, such as high blood pressure AND diabetes AND obesity, are relatively high. Multi-Layer Maps to the rescue!
An analysis that would have taken hours to produce with other tools, sourcing and standardizing multiple indicators from the latest data, ingesting the data into the system, and running joins and complex spatial intersections, is provided in PolicyMap in a matter of seconds.
New Enhancements to Multi-Layer Maps: Zoom Further, Clip Smarter, Download More
More Data at More Zoom Levels
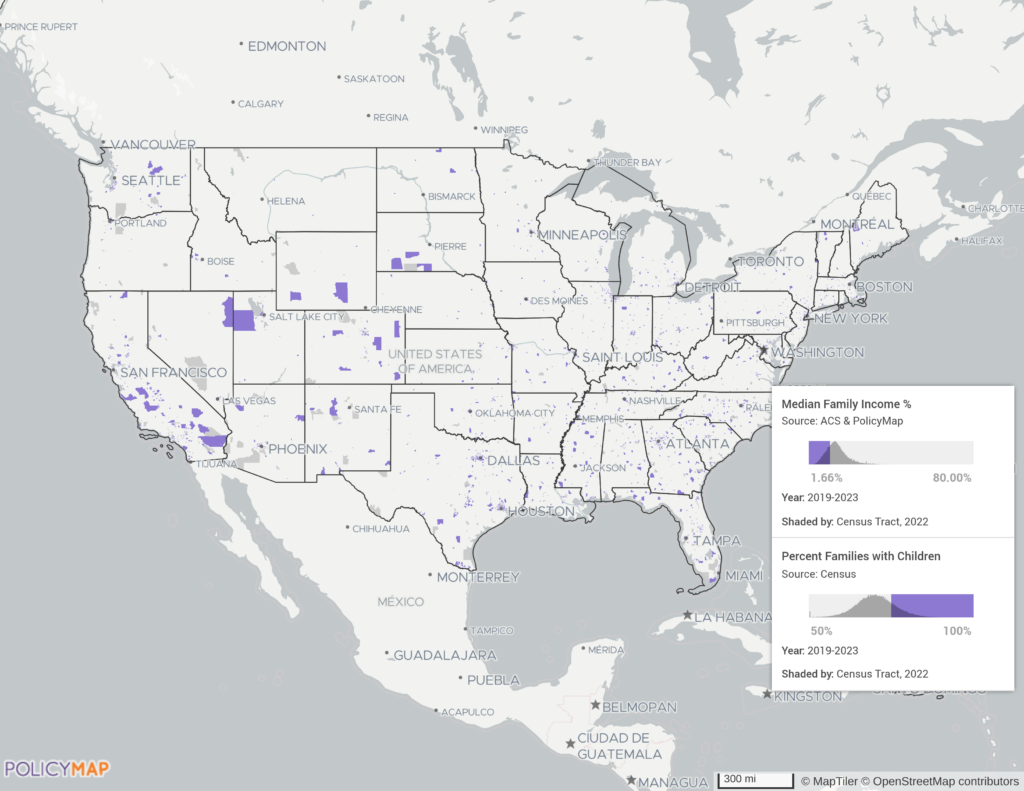
Running spatial queries on a web-based mapping application is hard work! If you tried to create a Multi-Layer Map last year showing intersections across several Census Tract layers for the whole US, you would have been prompted to zoom in closer to see results. Not anymore! Now you can layer more granular data at further out zoom levels. For example, users can now create a map for the entire US showing tracts that are considered low-moderate income AND where the majority of families have children living at home.
Multi-Layer Map Clipping
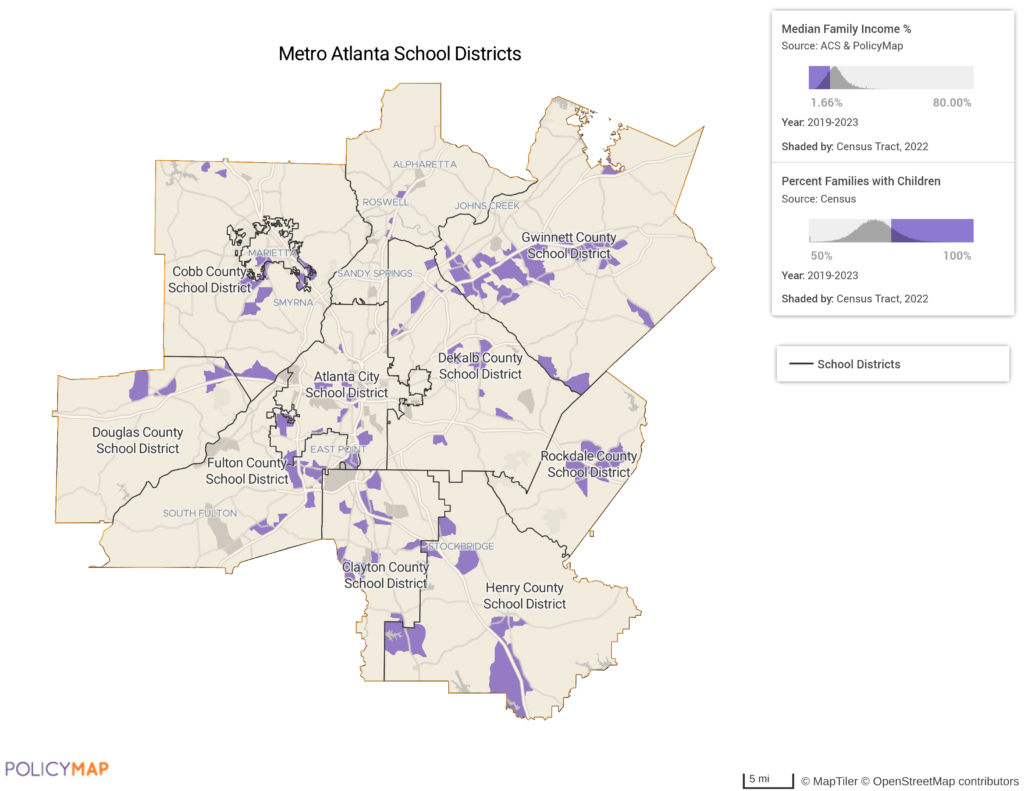
We’ve also added the ability to clip the visual output of a Multi-Layer Map. You can clip a map to a predefined geography, such as a state, county, metro area, or congressional district, using the Location Search Bar, or limit the view to a user-created Custom Region.
The map below shows the same layers from the previous example (low- to moderate-income areas with a high concentration of families with children) clipped to a Custom Region created from several Metro Atlanta school districts.
Multi-Layer Data Download
The latest enhancement to Multi-Layer Maps! Now, in addition to being able to export the visualization, users can generate Data Downloads based on the Multi-Layer Map they’ve created.
For example, a user performs a nationwide analysis of the convergence of chronic health conditions (high blood pressure and diabetes) and populations without health insurance. The map below shows ZIP code areas with above average prevalence of both chronic conditions AND relatively high rates of uninsured population.
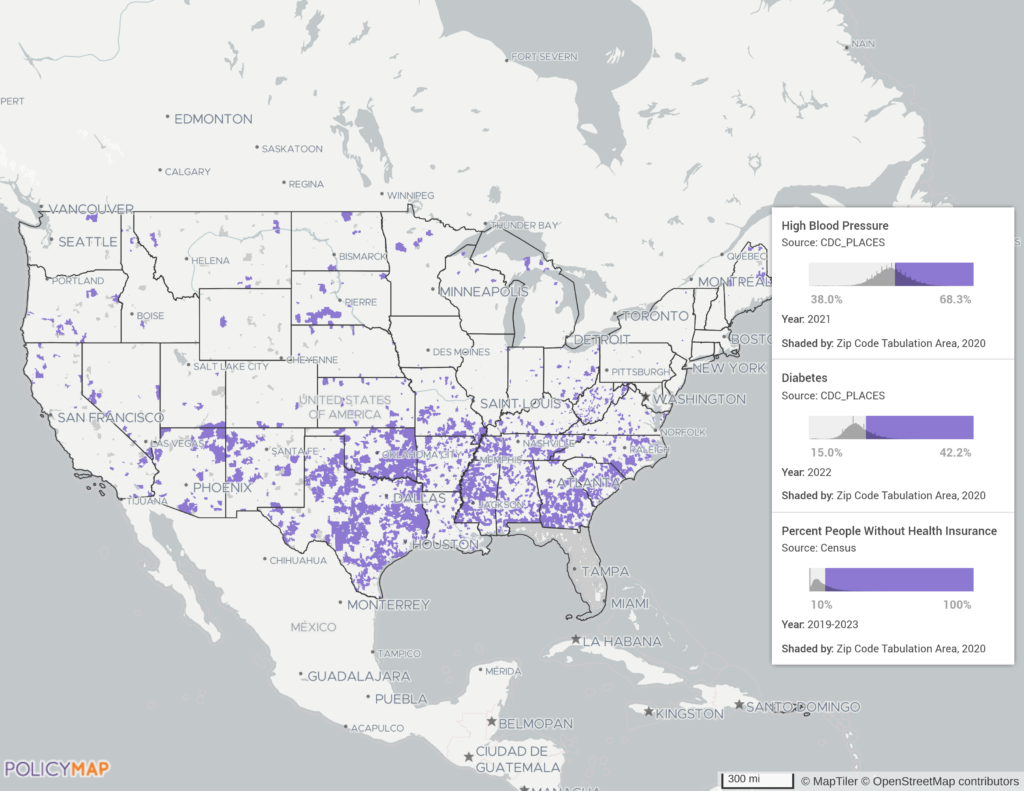
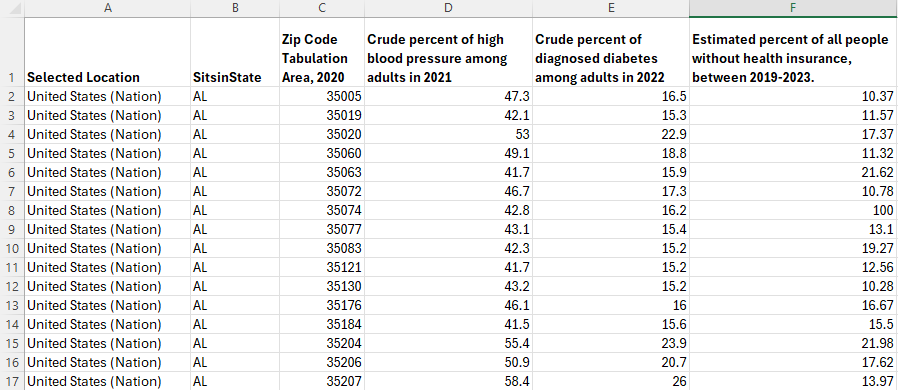
While the map visualization clearly reveals patterns, such as concentrations of qualifying ZIP codes across parts of the southern U.S., users may want to perform additional, ad-hoc analysis of the underlying data. With Multi-Layer Downloads, users can easily export the filtered layers to a CSV file for further analysis in Excel or another database system. The table below shows a sample of the downloaded data from this Multi-Layer Map, opened in Excel.
Download Options
We won’t go too far into the weeds, but it’s worth briefly explaining the different download options and what to expect when generating data from Multi-Layer Maps.
Downloads can be generated for both AND Multi-Layer Maps, which highlight areas that meet all conditions across all data layers, and OR Multi-Layer Maps, which show areas that meet the criteria for one or more layers. AND Multi-Layer downloads capture only the areas of intersection (the purple regions on the map) that satisfy every condition. In these downloads, all indicators are combined into a single CSV file. OR Multi-Layer downloads, by contrast, are delivered as separate CSV files for each layer included in the map, with each file containing only the geographies that meet that layer’s filtering criteria.
Point datasets, such as hospital locations or data uploaded through the Data Loader, can also be downloaded from AND Multi-Layer Maps. These downloads include point locations that fall within the areas of intersection and meet all filtering conditions. This functionality is especially useful for vetting uploaded project locations against investment or grant program criteria. One limitation to note: point downloads are available only when all layers on the map use the same geographic boundary type and vintage year (for example, all ZIP code layers), or when the layers use boundary types that are fully nested within one another (such as Census tracts and counties, or counties and states).
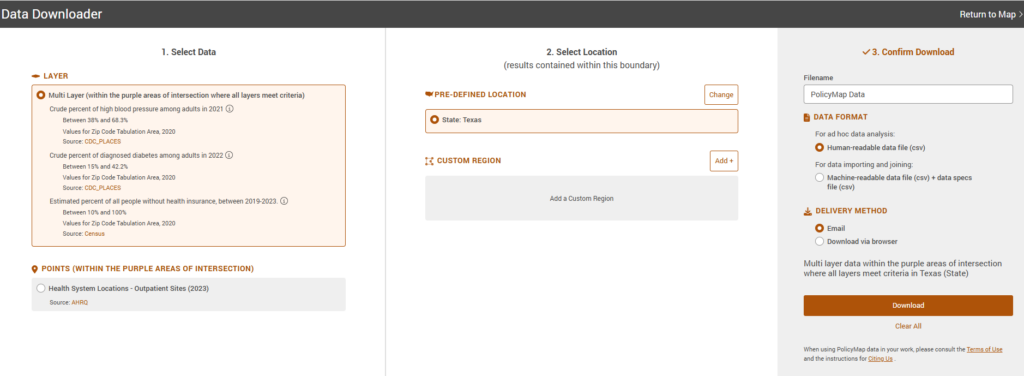
Multi-Layer Downloads can be generated for any predefined geography, including the nation, an individual state, or a congressional district, as well as for previously created Custom Regions. As with single-layer downloads, users can choose from multiple file formats and delivery options.
These options and the details of your Multi-Layer Map are all captured in the Data Downloader before you initiate the download.
And once your download is complete, your data file will be accompanied by a Multilayer Map Specifications file, which documents the layers included and the filtering conditions applied at the time the download was generated.
Ready to put Multi-Layer Maps to work?
We’re excited to share the many enhancements that have been added to Multi-Layer Maps throughout the year, and we hope these updates enable deeper, more powerful analysis for PolicyMap users.
Request More Information
Not a PolicyMap user yet? Contact our sales team to learn more about pricing and see a personalized demo of how Multi-Layer Maps can support your analysis and decision-making.