
PolicyMap Office Hours: Health Dashboards with PolicyMap

Thank you for joining the fifth session in our PolicyMap Office Hours webinar series! In this session, Brian Blacker, Senior Director of Product and Client Solutions, explores how to use PolicyMap’s new state-of-the-art Community Health reports to better understand and communicate health-related data.
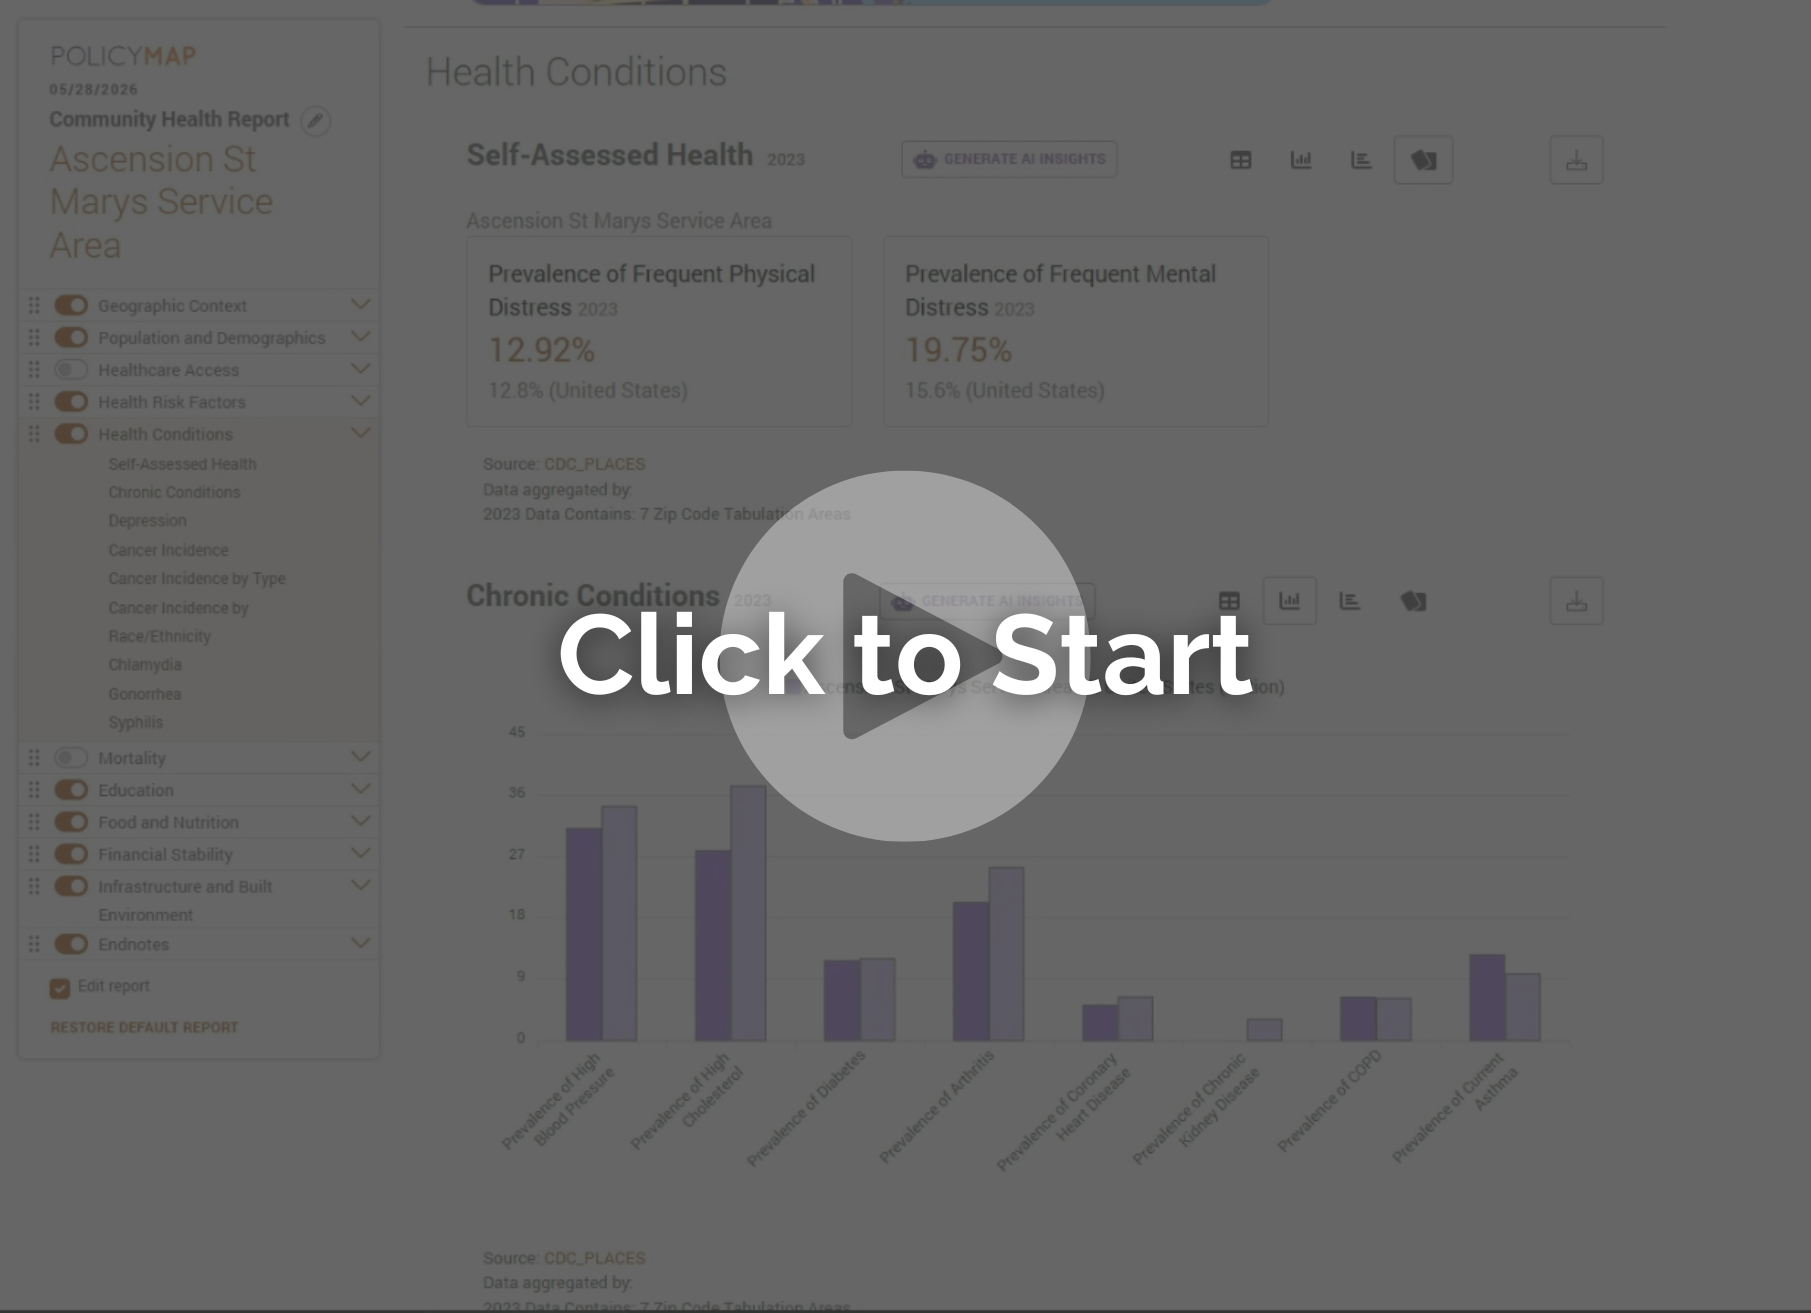
See the new Community Health report in action and learn how to generate reports for custom regions in order to get data on health conditions, risk factors, and social drivers specifically for your service area. Reports can be generated for standard geographies (zip codes, counties, states, etc.) as well as custom regions (assemblies of zip codes or counties, a radius around a location, etc.).
Whether you’re building a health or market assessment, pulling aggregate health figures and identifying needs for your community, or telling a story and creating visualizations that go beyond the map — this session is for you.
PolicyMap’s Newly Revamped Community Health Reports
Go beyond the data — visualize, assess, and communicate health data with ease!
Request More Information
Not a PolicyMap user yet? Contact our sales team to learn more about pricing and see a personalized demo of how the Community Health reports can support your health assessments and community analysis.