|
FEATURED POST |
|
|
Childcare Costs Take a Growing Share of Family Income
In counties across the United States, childcare costs can become incredibly burdensome. Full-day infant care can cost a typical family anywhere from around 5% to 30% of the median family income. New data from the National Database of Childcare Prices (NDCP), now on PolicyMap, shows just how steep these costs have become and how unevenly they fall on families. Explore where childcare costs put the greatest pressure on family budgets and how affordability differs across states and counties.
|
|
|
|
|
|
 |
|
|
POLICYMAP FOR SALESFORCE |
|
|
 |
|
Introducing PolicyMap for Salesforce–Our New Salesforce App!
Bring PolicyMap’s reliable neighborhood data and state-of-the-art mapping into Salesforce! Gain real location context about the communities you serve, right where you already work. Power smarter decision-making, investing, reporting, and grant-making by connecting market data directly to your Salesforce.
PolicyMap for Salesforce enriches your Accounts, Opportunities, and Leads with demographic, housing, and health data, helping you quickly identify which records sit in areas that meet program criteria or qualify for community-based incentives. Ideal for nonprofits, lenders, community development organizations, government agencies, and healthcare teams, the app gives both new and existing PolicyMap users seamless, in-platform access to trusted data and neighborhood-level insights.
Read More |
|
 |
|
Live Webinar – Introducing PolicyMap for Salesforce: Neighborhood Data at Your Fingertips
Join us Tuesday December 2nd at 1pm EST
Join us for a live demo of PolicyMap for Salesforce, a new app that brings neighborhood-level data and maps directly into your Salesforce environment. See how the app helps enrich your records, visualize community insights, and generate data-driven reports. We’ll end with a live Q&A.Register Here |
|
|
|
 |
|
|
ON THE BLOG |
|
|
 |
|
Libraries That Mean Business: Helping Entrepreneurs Map Opportunity with PolicyMap
Libraries are helping entrepreneurs turn local insight into economic opportunity. Across the country, small business owners are using PolicyMap through their libraries to assess markets, find ideal locations, and make informed decisions about where to grow. See how libraries are using data-driven mapping to empower residents, support small business creation, and strengthen community wealth.
Read More |
|
|
 |
|
|
IN THE NEWS |
|
|
 |
|
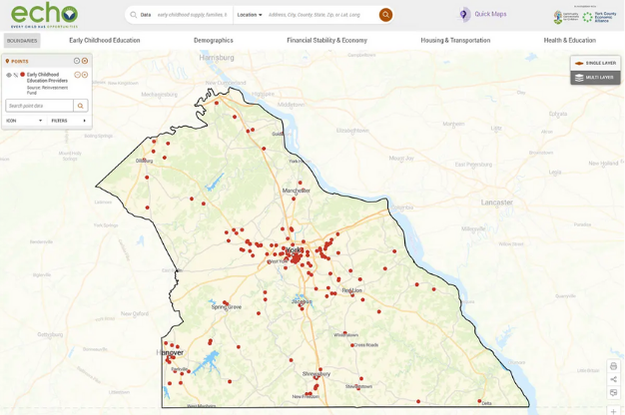
ECHO Launches New PolicyMap-Powered Platform to Advance Early Childhood Education in York County
ECHO’s new Early Childhood Education Map, built with PolicyMap, brings clarity to where childcare shortages exist across York County. Paired with their latest gap analysis, the tool visualizes provider locations and key community indicators, helping leaders pinpoint where early learning needs are most urgent. Learn where gaps are most concentrated and where investment can make the greatest impact.
Read More |
|
|
|
|
 |
|
 |
|
**New Data** from BLS that shows industry specialization at the county and state level has been added to PolicyMap. This data comes from an already existing dataset: BLS Quarterly Census of Employment and Wages (QCEW), which provides detailed data on employment and wages by industry.
**New Data** enhancement layers on predominant housing tenure are now available on PolicyMap. This data uses ACS 5-year estimates to identify whether most occupied housing units in a geography are owner-occupied or renter-occupied. Disaggregations are available by race and ethnicity to explore which tenure type is more common within each group individually.
**New Data** The U.S. Department of Labor National Database of Childcare Prices dataset is now available on PolicyMap.
Qualified Census Tracts (QCTs) and Difficult Development Areas (DDAs) from HUD have been updated to 2026 data.
Supplemental Nutrition Assistance Program (SNAP) recipient data from the Census Bureau has been updated to 2022 data.
Predominant Housing Tenure data has been newly added to PolicyMap. This dataset uses data from the Census’ American Community Survey (ACS).
The Adjusted Cohort Graduation Rate data from the US Department of Education is now updated to School Year 2023. It is available to all users and can be found under Education > School District Statistics > Graduation Rate.
We are committed to our promise of curated, cleaned, standardized, and always updated data. We’re posting real-time updates on our website, LinkedIn and BlueSky.
|
|
|
|
 |
|
Published Research
Explore scholarly works from students and researchers using PolicyMap.
Residential segregation, housing cost, and smoking behaviors in Black Americans, published in ScienceDirect
Open PolicyMap Training Sessions
Offered twice a week. Register here.
Level 1: Learning the basics of PolicyMap
Level 2: Learn the Data Loader, Multi-Layer Maps, and other Advanced Features
Open to non-subscribers. Course times rotate weekly. Don’t see a time that works for you?
Contact us.
|
|
|
|
 |
|
Join Us!
Future Forum: From Challenge to Change – Building for Tomorrow
December 4, 2025
Washington, D.C.
PolicyMap is excited to join ULI Washington for their 4th Annual Future Forum! This year’s Forum brings together leaders across business, government, and the nonprofit sector to address the region’s most urgent housing and economic development challenges.
Be sure to catch the CRED Talk featuring Jacinda Linderman, Senior Data Analyst at PolicyMap, in the session “The Future of Data and Development.”
Register here!
|
|
|
|
|
|